

MDI Dashboard Technical Guide
(Updated: July 12, 2024)
The MDI Dashboard Technical Guide is intended to support the interpretation and use of data on the MDI Data Dashboard.
The MDI Data Dashboard is an online, interactive tool for exploring trends in MDI data collected from the 2018-19 school year to the present school year. The MDI Data Dashboard allows users to explore MDI data available over time at the school district and neighbourhood level. The data available through the Dashboard are reported based on children’s home postal codes and include children who completed the MDI in a participating school district or independent school that live within the boundary type selected.
RELATED: See more information on boundary types
The MDI Technical Guide provides explanations of each module and all chart views available on the dashboard. The Technical Guide also highlights dashboard features and offers helpful tips for navigating the dashboard. Scroll down to Using the Dashboard or choose from the following links to dive right into more information a Dashboard module:
Introduction to the MDI Data Dashboard
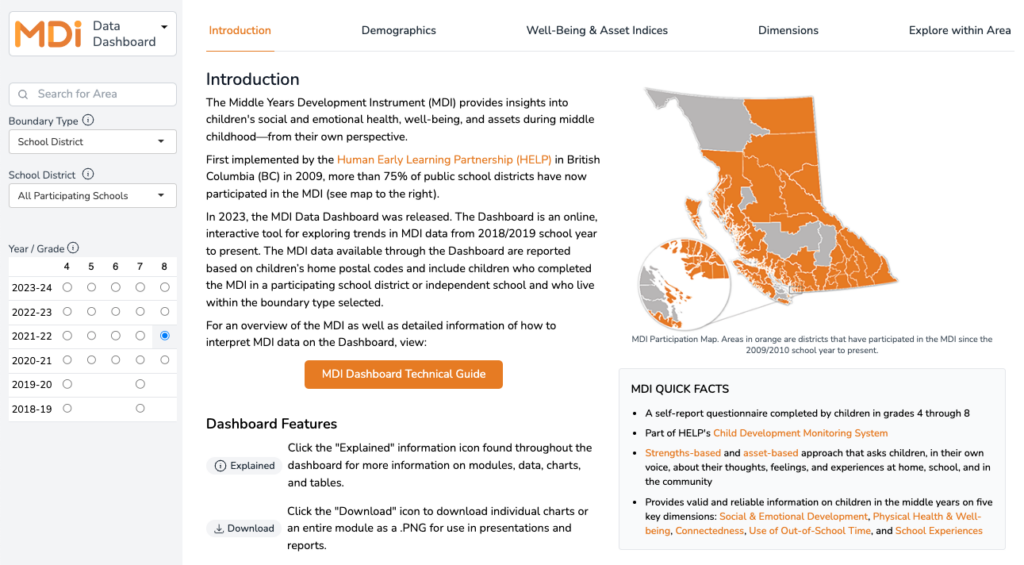
Welcome to the MDI Data Dashboard!
Explore MDI data collected between the 2018-19 school year to present from participating school districts. This Technical Guide provides information on dashboard features, explanations of maps and chart views available, and gives useful tips for navigating and interpreting data.
Before getting started, there are a few useful things to note about the data in the dashboard.
About the Data
The data available through the Dashboard are reported based on children’s home postal codes. The data include children who completed the MDI in a participating school district or independent school that live within the boundary type selected.
Suppression
The MDI collects data at the population-level. When coverage of the population is low or the population size of an area is very small, data may be suppressed. More specifically, data are suppressed when there are fewer than 35 children in a school district or neighbourhood for confidentiality reasons. The data are also suppressed when the uncertainty of the results (i.e., the margin of error) is greater than 10% which can result from low coverage, particularly in areas with small populations.
Margin of Error
Margin of error is the degree of uncertainty about the exact value of what is being measured, when results are based on samples rather than the whole population. The margin of error for any particular result is a function of both the size of the sample and the size of the population (i.e., the participation rate). Larger populations require a smaller participation rate than smaller populations, to have the same margin of error. At HELP, results are reported when the margin of error is +/-10% or less; otherwise, results are suppressed due to too much uncertainty.
MDI School District and Community Reports
The MDI Data Dashboard replaces the neighbourhood profiles previously included in the MDI School District & Community Reports. MDI School District Reports for participating districts are still available in PDF format. Public school district reports may be accessed from the HELP website: MDI School District Reports*
Note: Only those reports that meet the suppression threshold are publicly available. Contact the MDI team for more information at mdi@help.ubc.ca.
Due to limitations of the current dashboard and sensitivity around some data, the MDI Data Dashboard does not include the following data:
- School Experiences measures:
- Academic self-concept
- School climate
- School belonging
- Victimization and bullying
- Number of important adults
- Children’s wish activities
These data are included in the annual MDI School District Reports.
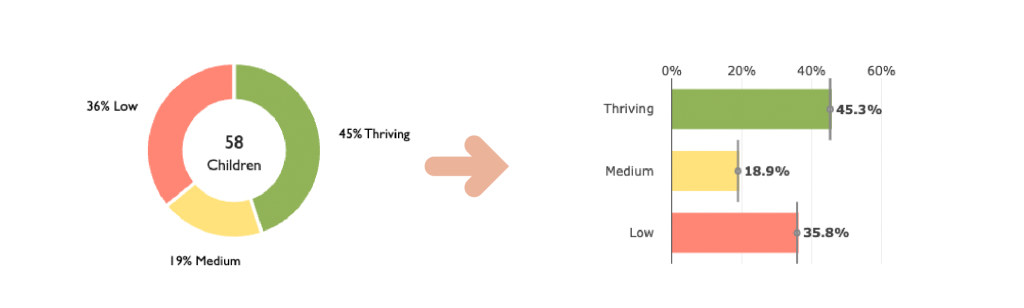
It is also important to note that there are some differences in visualization from the PDF report and the Dashboard. Among them are the Well-Being and Assets Indices.
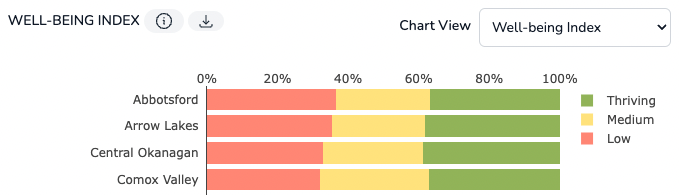
On the PDF report, the Well-Being Index is represented as a wheel graphic. On the Dashboard the Well-Being Index is represented as a grouped bar chart:
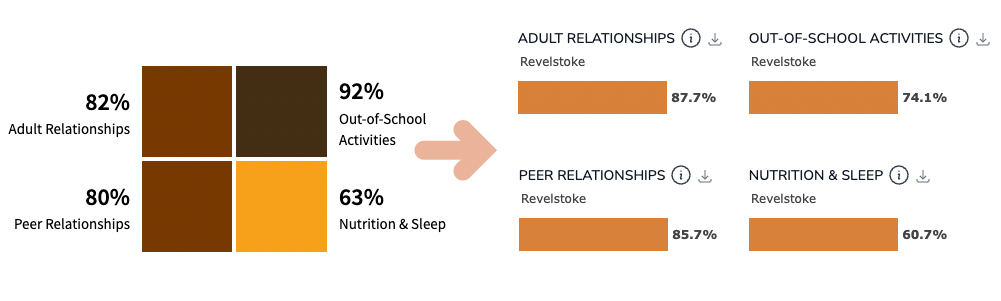
On the PDF report, the Assets Index is represented as four squares. On the Dashboard the assets may be selected to view individually and are now a single orange colour:
The next section highlights features of the dashboard to help you get started.
Getting Started on the Dashboard
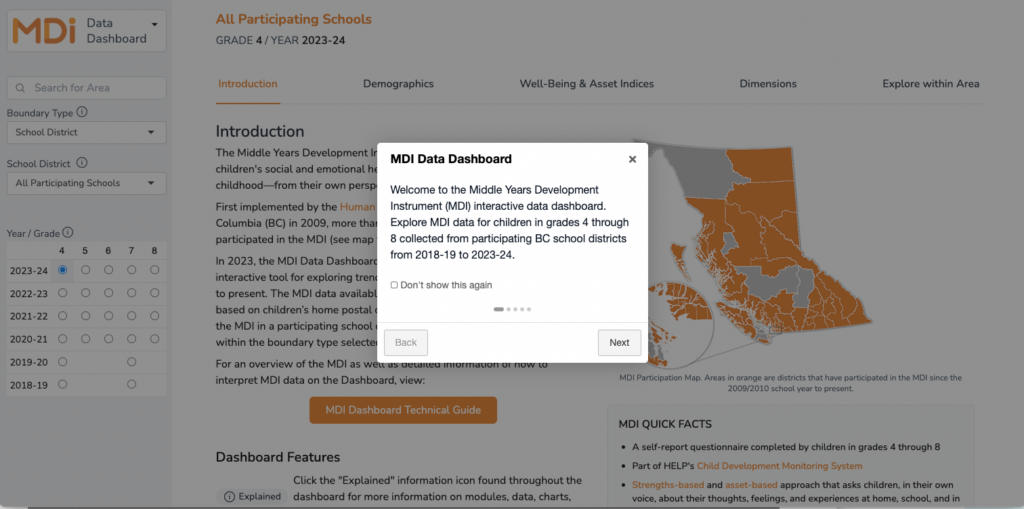
Guided Tour
When accessing the MDI Data Dashboard for the first time, a guided tour pops up that highlights key features of the Dashboard. Check the “Don’t show this again” box if you do not want the tour to appear every time you visit the Dashboard. To access the guided tour again, click the “Replay Tour” link located in the Dashboard footer.
Throughout the Dashboard, you will find the “Explained” and “Download” icons beside section titles and beside individual maps and charts within a module.
 – Click the “Explained” information icon found throughout the dashboard for more information on modules, data, charts, and tables.
 – Click the “Download” icon to download individual charts or an entire module as a .PNG for use in presentations and reports.
Navigation
On the left-side of the Dashboard is the main navigation panel. This is where search areas are set, grade and year selections are made, and also where you can switch from the MDI Dashboard to the EDI Dashboard.
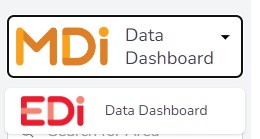
Project Switcher
Clicking on the MDI logo brings up a drop-down menu that allows you to switch to the EDI Data Dashboard. See the EDI Quicklinks below for more information on the EDI.
EDI QUICKLINKS:
EDI Data Dashboard
EDI Data Dashboard Technical Guide
More information about the EDI
Search Bars and Boundary Type
If you know the specific school district or neighbourhood you would like to explore, use the “Search for Area” search bar to type the name of the district or neighbourhood of interest.
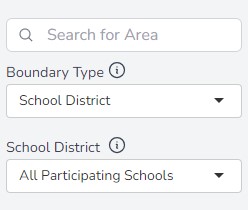
Alternatively, you may use the next two drop-downs to first select a Boundary Type then the next drop-down will allow you to select an area within that boundary type. The MDI Data Dashboard allows users to explore MDI data at two boundary types: the Ministry of Education & Child Care School District boundaries and by HELP Neighbourhoods*.
NOTE:
*HELP Neighbourhood boundaries were created by HELP through meaningful aggregations of census dissemination blocks, postal code boundaries, city planning boundaries, and geographic features. The neighbourhood boundaries were vetted through a community review process and were adjusted when necessary to remain useful for communities. The neighbourhood boundaries were constructed to nest within school district boundaries.
By default, the Dashboard is set to the “School District” Boundary Type with “All Participating Schools” as the selected area. The data for “All Participating Schools” includes all children that participated in the MDI for the selected grade and year.
Once a boundary type and area are selected, the Dashboard will display data for the selection. Depending on the selected area, comparative data for the top-level aggregation will also load up. For example, when viewing Neighbourhood data, the data from the related School District are shown and when viewing School District data, the data from All Participating Schools from the grade and year selected are shown.
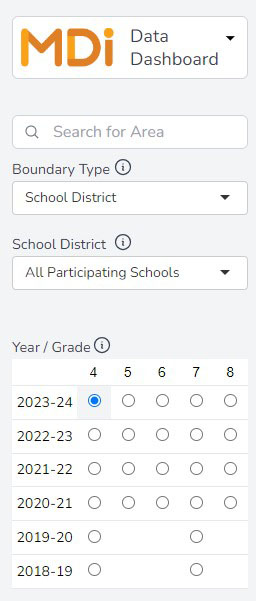
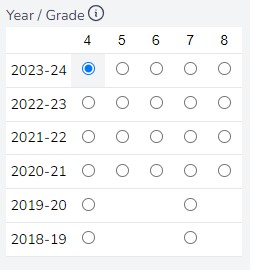
Collection Year & Grade Selector
School districts are invited to participate in the MDI each school year and participating districts choose which grades to administer each year—grades 4 to 8 are available.
The year and grade selector is designed in a matrix style so that you may instantly see the combination of year and grade available for the selected area. By default, the lowest available grade level for the most current year of data available will be selected.
NOTES ABOUT COLLECTION YEARS:
The years available on the Dashboard are known as collection years. Collection years correspond to the school calendar year (September to June). MDI data are collected in January-February of the school year. For example, if “2021-22” is an available collection year, selecting it will display MDI data collected in the 2021-22 school year.
The “2019-20” MDI data available in the Dashboard was collected in January-February 2020 just prior to the World Health Organization’s (WHO) declaration of the COVID-19 pandemic in March 2020. The data available in the Collection Years “2018-19” and “2019-20” are considered pre-pandemic data. On May 5, 2023, the WHO declared an end to COVID-19 as a public health emergency. The “2022-23” MDI data available on the Dashboard were collected just prior to this declaration.
Currently, only data collection starting at the 2018-19 school year are available on the Dashboard. Some school districts have been collecting MDI data earlier than this school year. If you are interested in accessing MDI data from previous years, please contact us mdi@help.ubc.ca.
Grades
From 2009 to 2020, the MDI was only available for children in grades 4 and 7. As of the 2020–21 school year, grades 5, 6 and 8 were added as options. Now, participating districts are able to choose to participate in grades 4 through 8 and may choose to collect data across multiple grades as desired. Some school districts also choose to follow cohorts over time—for example, collecting data from children in grades 4 and 7 one year, and then the same group of children in grades 5 and 8 the following year.
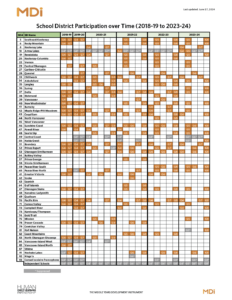
TIP: Use the MDI School District Participation Over Time resource to see at a glance what years and grades a school district has participated.
The next section of this technical guide will explain how to use the various features of the MDI Data Dashboard.
Using the Dashboard
To the right of the navigation panel is the main information panel where charts and data are viewed and where modules may be selected. This main panel has key features that include:
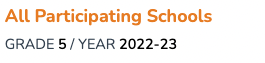
Breadcrumb
A breadcrumb or “breadcrumb trail” is another navigation feature that shows your geographical location within the hierarchy of boundary types and areas. For example in this breadcrumb, the data shown are for Aldergrove – N3501. Aldergrove is a neighbourhood and is the lowest geographic level of data available on the Dashboard.
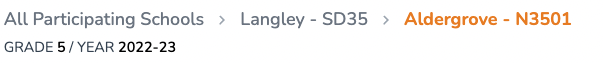
The next geographic level you can go in this breadcrumb example is from neighbourhood-level to school-district level. In this example, Aldergrove – N3501 is a neighbourhood within Langley – SD 35 (Langley school district). Clicking Langley – SD 35 on the breadcrumb will refresh the data on the Dashboard for Langley school district.
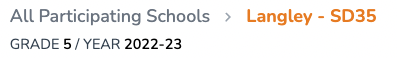
The final geograpahic level you can go in this breadcrumb example is from school district-level to “All Participating Schools.” Clicking “All Participating Schools” in the breadcrumb will refresh the data on the Dashboard for all children that participated in the selected grade and year.
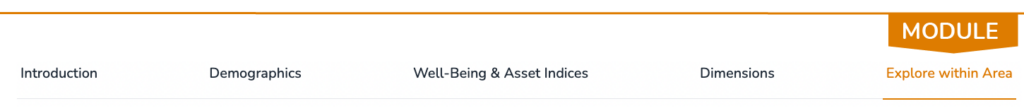
Module Navigation
The MDI Data Dashboard has five modules to choose from. Each module is accessed through this top-level navigation:

Further information and tips for navigating each of the Dashboard modules are outlined in the next section. Scroll or use the links below to jump directly to a section:
Exploring MDI Data
Begin exploring data by choosing a module. This section explain each module in detail including all available chart views in the module.
Module: Introduction
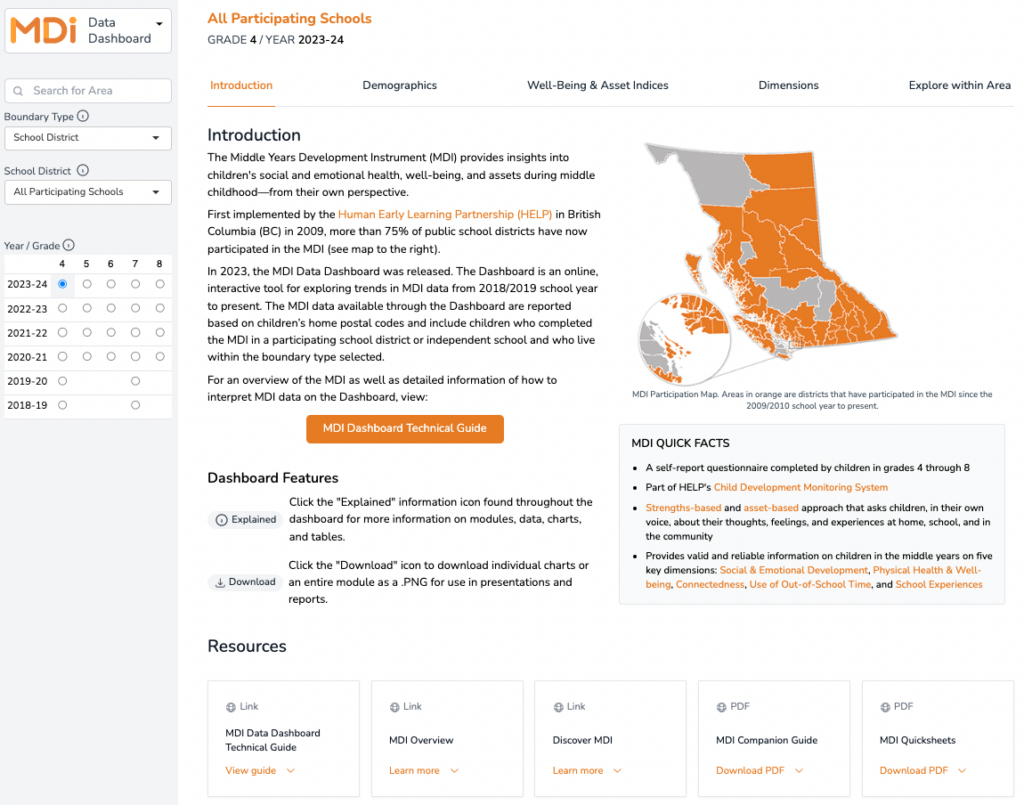
The Introduction module serves as a landing page when first accessing the MDI Data Dashboard. The Introduction provides a brief overview of the MDI including some quick facts about the MDI. An overview of the Dashboard and some key features are highlighted.
Helpful resources for using the MDI Data Dashboard may also be found in this module including:
- MDI Overview – Learn more about the Middle Years Development Instrument (MDI) including information on data collection and key MDI contacts.
See MDI overview - DiscoverMDI – Find information and helpful resources for using MDI data in school districts and across communities – PowerPoint slides, workshop resources, research briefs, examples of MDI data in action and more.
See DiscoverMDI - MDI Companion Guide – Provides more detailed information on the questions that make up MDI measures.
View the MDI Companion Guide - MDI Quicksheets – A compilation of two-page, downloadable, PDF summaries of key MDI concepts, including research highlights and ideas for moving to action with MDI results.
View the MDI Quicksheets
Module: Demographics
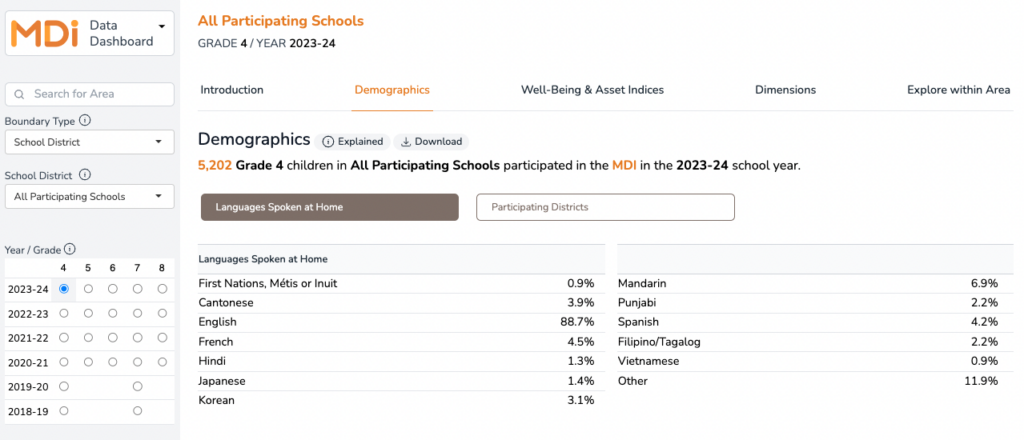
Demographic information provides contextual information for the MDI data in the Dashboard. The data available on the MDI Data Dashboard are reported based on children’s home postal codes and include children who completed the MDI in a participating school district or independent school that live within the boundary type selected.

The demographics headline contains the total sample for the specific area, grade and year selected. In this example, a total sample of 16,555 Grade 8 children overall participated in the MDI in the 2023-24 school year. The total sample refers to the total number of children represented in the data for the grade, year, and area selected. Children are included in the sample if they complete at least one question and the data are reported.
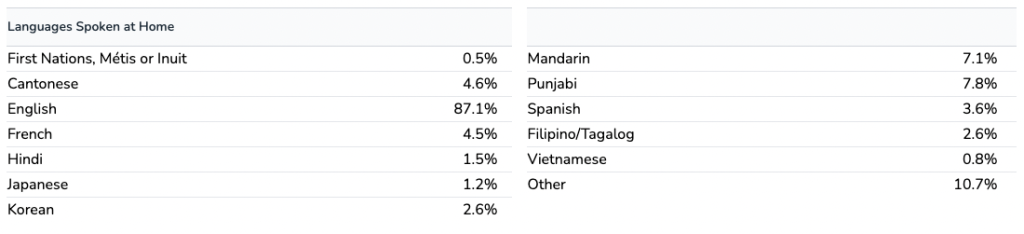
Languages Spoken at Home
On the MDI, children are asked, “What is the first language you learned at home?” Children are able to select more than one language spoken at home from a list of languages.
Participating Districts
School districts choose what grades and how frequently they want to participate in the MDI. Results for large districts tend to be closer to the average for All Participating Schools. The average is based on participating schools and does not represent all schools in the entire province for the selected grade and year. The Participating Districts chart lists the school districts that participated in MDI data collection for the grade and year selected along with the number of children that completed an MDI questionnaire in each participating district.
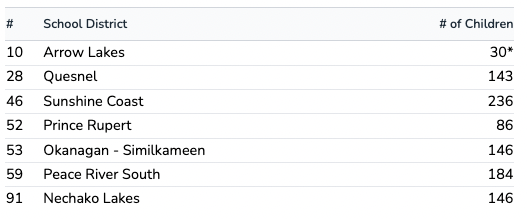
For some participating districts, their data are not publicly available on the Dashboard due to suppression. These districts are indicated by an asterisk (*) on the table. Data are not publicly available when there are fewer than 35 children, for confidentiality reasons. The data are also suppressed when the uncertainty of the results (i.e., margin of error) is greater than 10%, which can result from low coverage particularly in areas with small populations.
Refer to the MDI School District Participation Over Time document for a full list of participating school districts and their participation history for the years of data available on the MDI Data Dashboard.
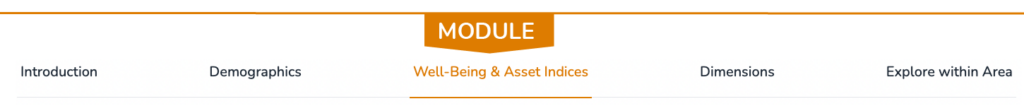
Module: Well-Being & Asset Indices
This module highlights data from the Well-Being Index and the Assets Index. Just below the heading for this module is a row of buttons. This row of buttons is a sub-menu within this module that allows users to select between the Well-Being Index or one of the four assets of the Assets Index.
This module features a map that, when an area is selected within the map, has the ability to refresh data shown on the dashboard to the area selected on the map.
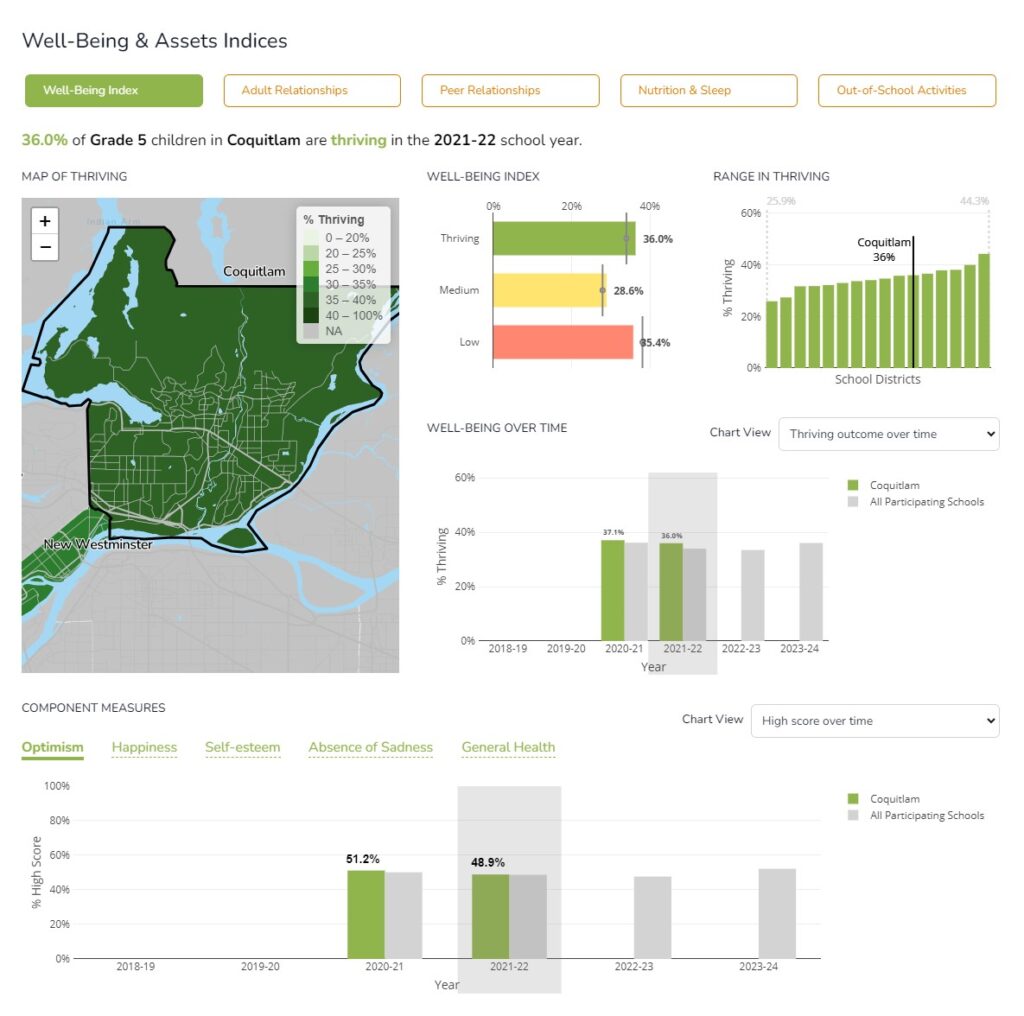
The following section explains the available chart views when the Well-Being Index is selected:
KEY CONCEPTS IN THIS MODULE — Well-Being Index View
- Thriving (High Well-Being) — Children who score in the high range on at least 4 of the 5 measures of well-being and have no low-range scores. Also referred to as Thriving Outcome.
- Medium Well-Being — Children who score in the high range on fewer than 4 of the 5 measures of well-being, and have no low-range scores.
- Low Well-Being — Children who score in the low range on at least 1 of the 5 measures of well-being.
- The Assets Index is reported as the percentage of children reporting the presence of an asset.
- Measure – (or “component measure”) is made up of a collection of related responses from the MDI questionnaire. The Well-Being Index combines MDI measures related to children’s physical health and social and emotional development that are of critical importance during the middle years.
MAPS & CHARTS IN THIS MODULE — Well-Being Index View
Map of Thriving — Shows the percentage of children who are thriving (high well-being). Refer to the legend to interpret the variability of colour on each map. Use the zoom feature (+ and – control) to expand or narrow down a view. Hovering on areas of the map to reveal more data and clicking on an area of the map will select it and refresh the Dashboard to data for that selected area.
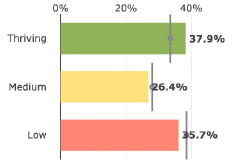
Well-Being Index Chart — Shows the percentage of children who are thriving or have high (green), medium (yellow), and low (red) well-being.
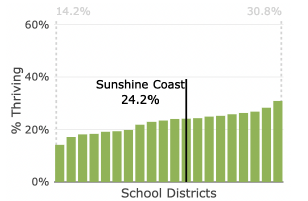
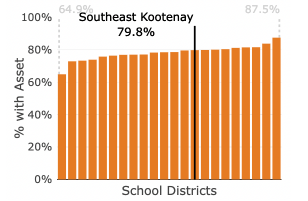
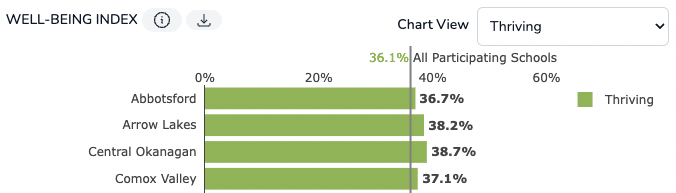
Range in Thriving Chart — Shows the distribution of children thriving in increasing order within a boundary type. Each bar represents the thriving rate for one area within that boundary type. The black vertical line that appears when a specific area is selected indicates the thriving rate for that selected area. The light grey percentages on either end of the chart indicate the rates for the area with the lowest and highest percentages of children thriving for the selected grade and year.
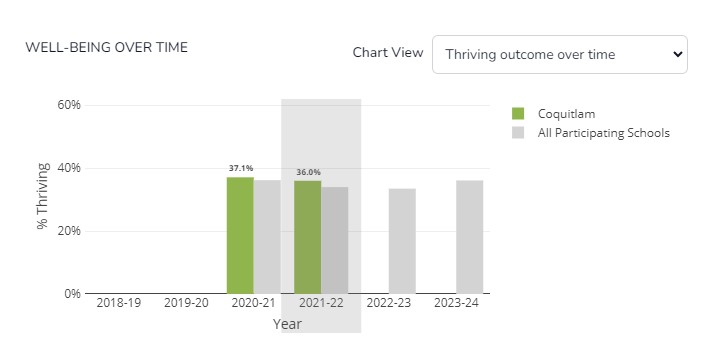
Well-Being over Time Chart View: Thriving outcome over time — Shows the percentage of children thriving over time in a specific area for the selected grade and year. The grey comparison bars represent the average for the boundary type selected. If the boundary type selected is “School District,” the grey bars will represent the average for All Participating Schools. If the boundary type selected is “Neighbourhood,” the grey bars will represent the school district averages for each year that data are available.
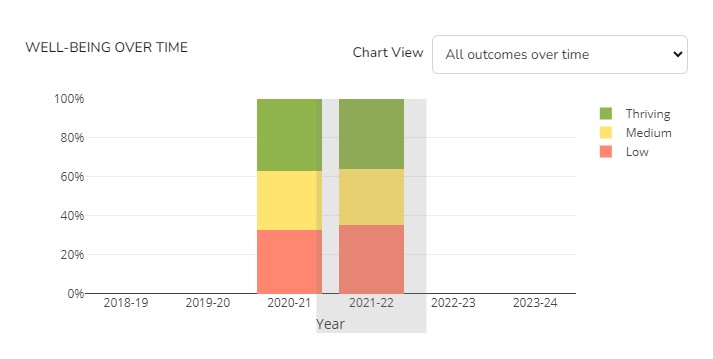
Well-Being over Time Chart View: All outcomes over time — Shows the percentage of children who have high (green), medium (yellow), and low (red) well-being in the specific area for the selected grade and year over time.
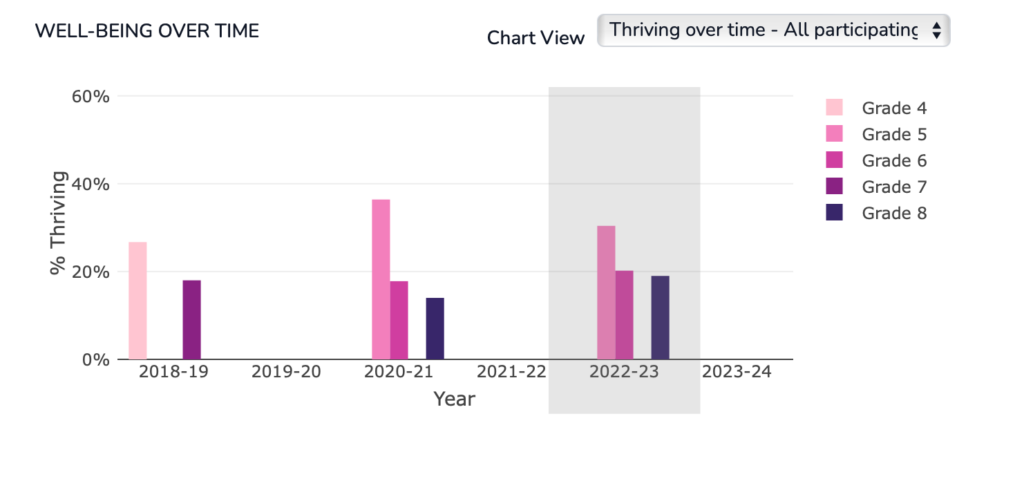
Well-Being over Time Chart View: Thriving over time – All participating grades — Shows the percentage of children thriving over time for all participating grades in a specific area for the selected grade and year. Use the legend to the right of the chart to toggle each grade off and on.
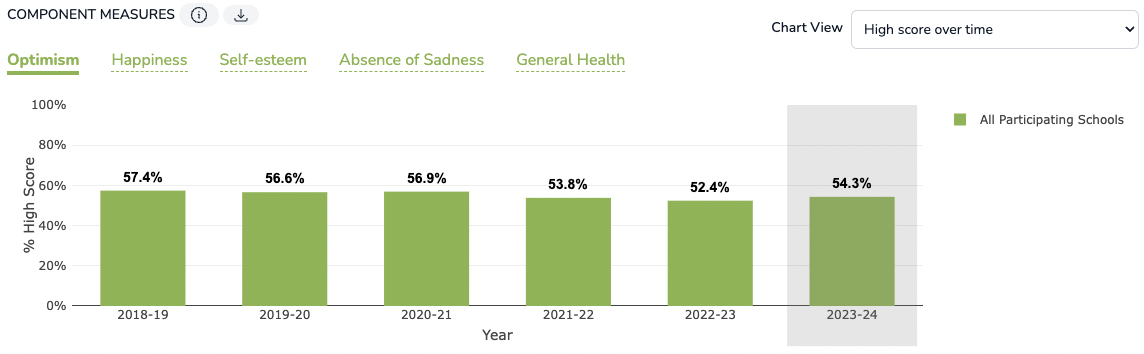
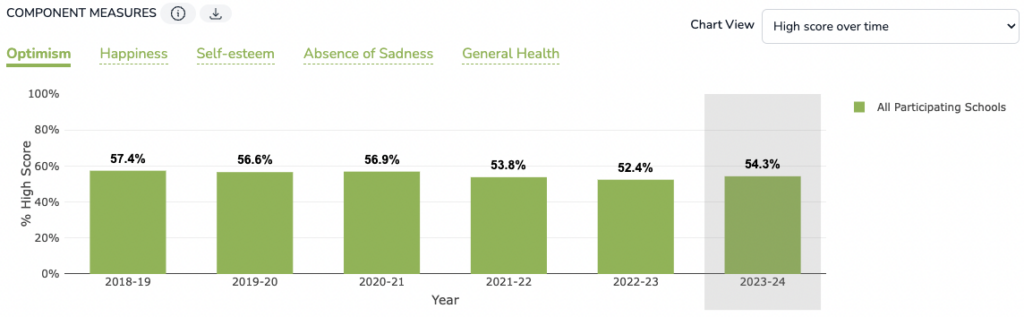
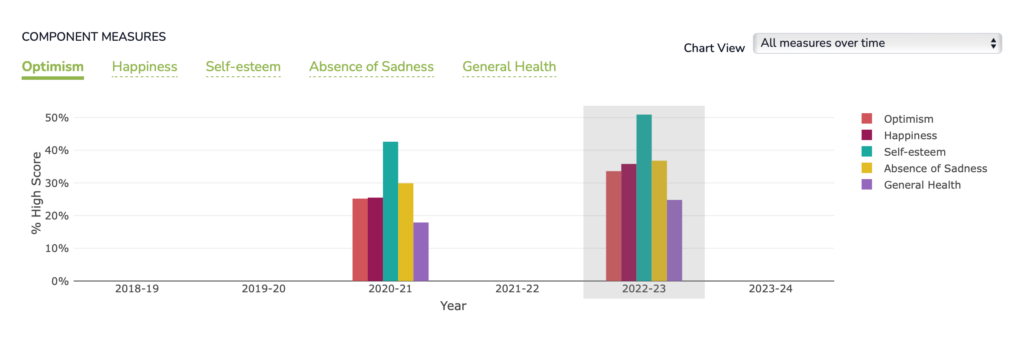
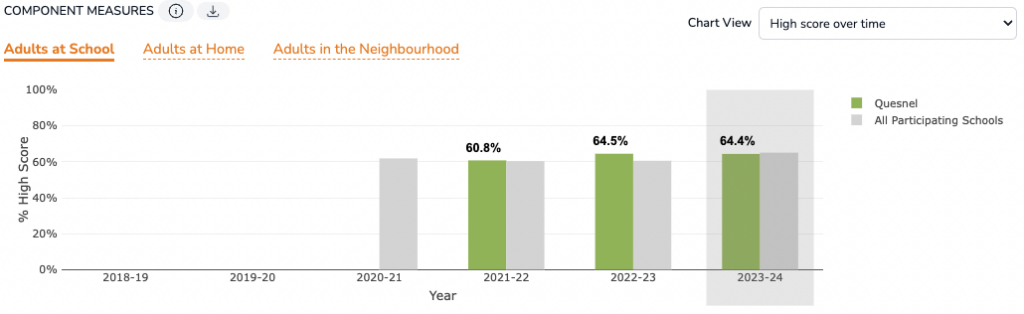
Component Measures: Well-Being Index – The Component Measures section highlights the measures that make up the Well-Being Index. The measures within the Well-Being Index are Optimism, Happiness, Self-esteem, Absence of Sadness, and General Health measures. The Chart View drop-down offers additional options to view the data. By default, the “High score over time” chart view is selected.
Additional chart views to choose from within the Component Measure section include:
- Component Measures Chart View: High score over time — Shows the percentage of children reporting the high category for the selected component measure.
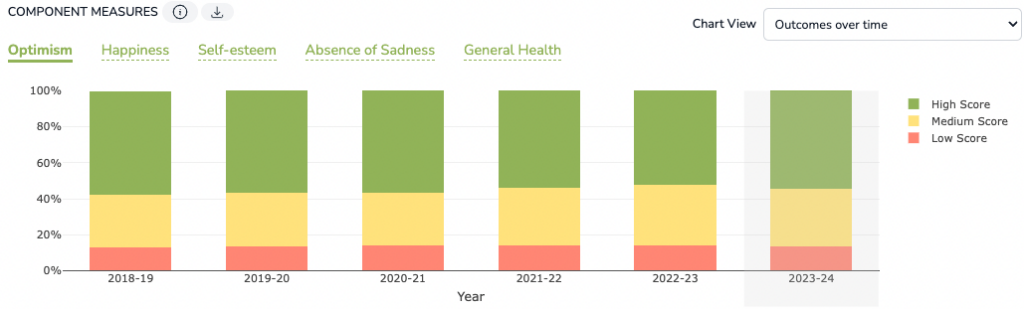
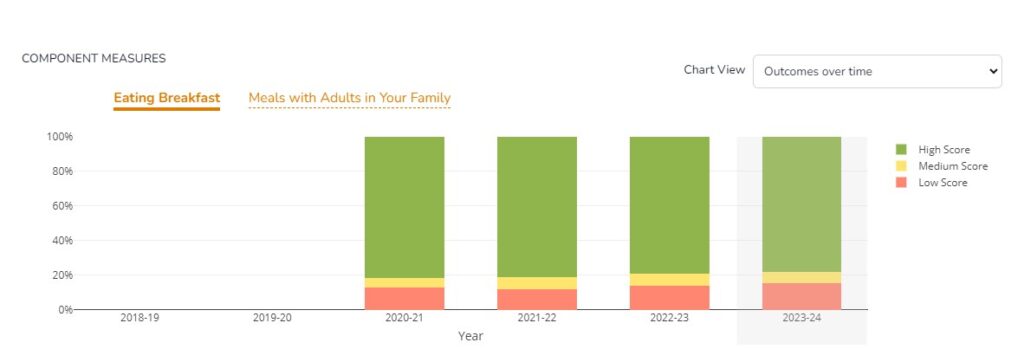
- Component Measures Chart View: Outcomes over time— Shows the high (green), medium (yellow) and low (red) outcomes for the selected component measure over time.
- Component Measures Chart View: All measures over time – Shows the percentage of children with a high score for all component measures for the selected grade over time.
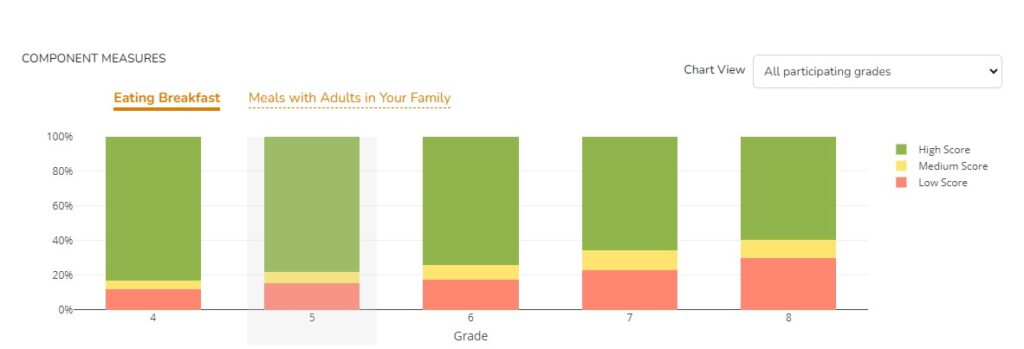
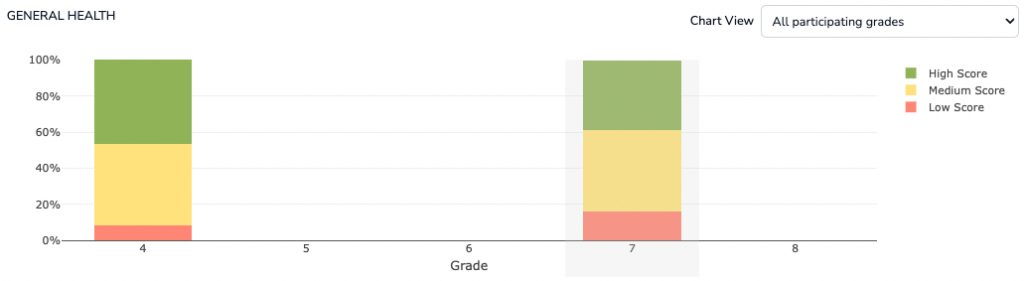
- Component Measures Chart View: All participating grades – Shows the high (green), medium (yellow) and low (red) outcomes for the selected component measure across all participating grades for the selected school year.

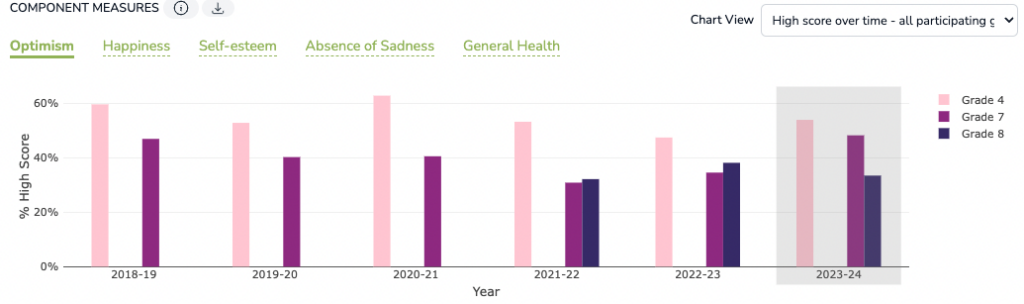
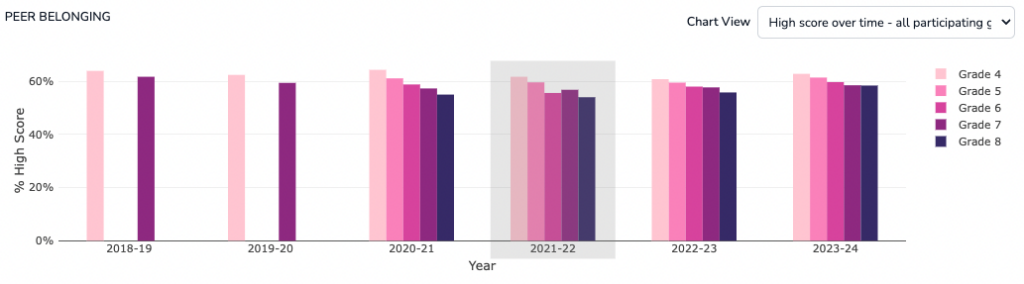
- Component Measures Chart View: High score over time – all participating grades – Shows the percentage of children with a high score for the selected component measure for all participating grades over time.
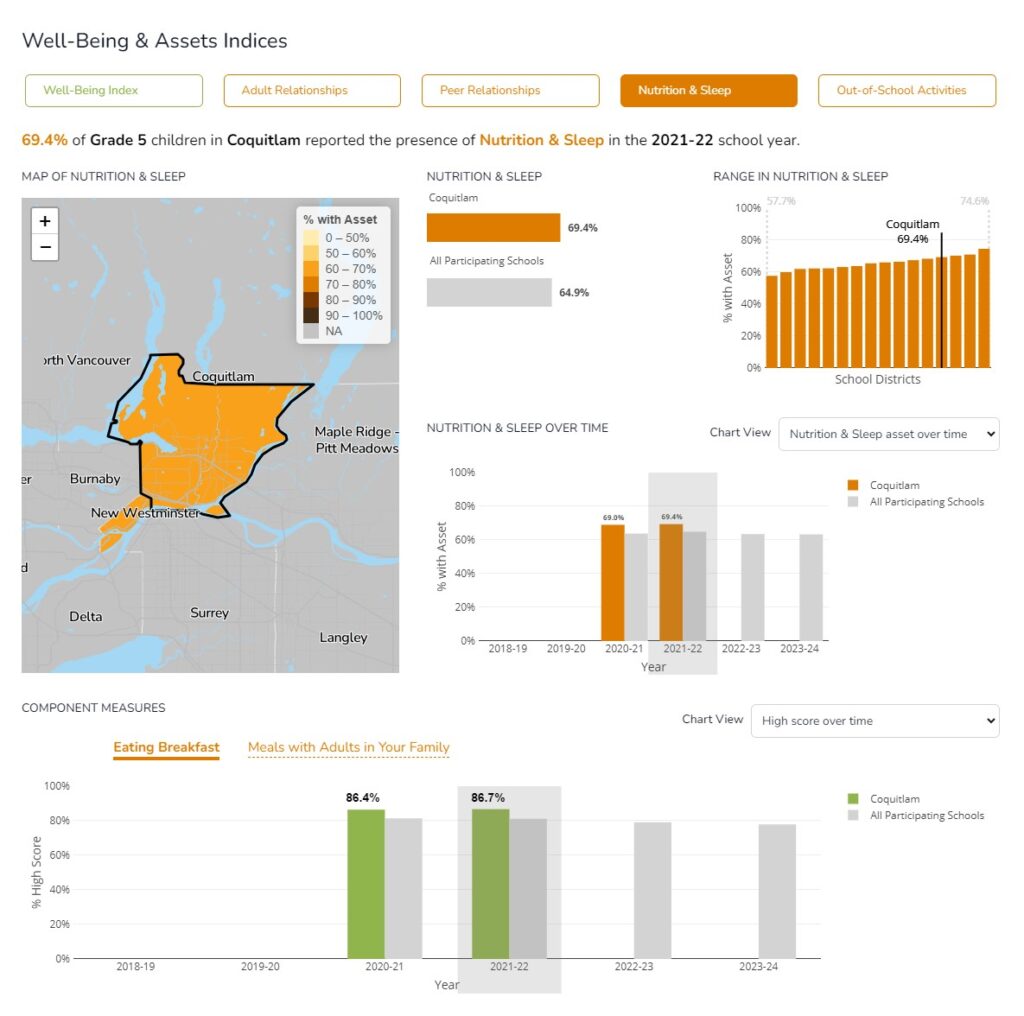
The following section explains the available chart views when one of the four Assets is selected. This module features a map that, when an area is selected within the map, has the ability to refresh data shown on the dashboard to the area selected on the map.
KEY CONCEPTS IN THIS MODULE — Assets Index View
- The Assets Index is reported as the percentage of children reporting the presence of an asset. There are four assets in the Assets Index: Adult Relationships, Peer Relationships, Nutrition & Health, and Out-of-School Activities.
MAPS & CHARTS IN THIS MODULE — Assets Index View
Assets Map — Shows the percentage of children reporting the presence of the selected asset. Refer to the legend to interpret the variability of colour on each map. Use the zoom feature (+ and – control) to expand or narrow down a view. Hovering on areas of the map to reveal more data and clicking on an area of the map will select it and refresh the Dashboard to data for that selected area.
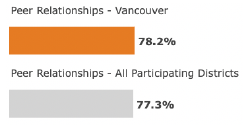
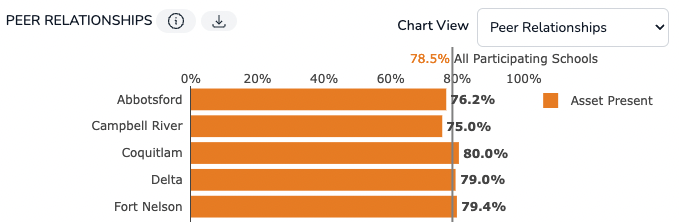
Asset Index Chart — Shows the percentage of children reporting the presence of the selected asset in their lives. The grey horizontal bar represents the average for All Participating Schools or neighbourhoods depending on the selected boundary type. Hover over the bar charts to see the number of children reporting the presence of the selected asset.
Range in Asset Chart — Shows the distribution of children reporting the presence of the selected asset in increasing order within a boundary type. Each bar represents the rate of children reporting the selected asset for one area within that boundary type. The black line, which appears when a specific area is selected, indicates the rate of children reporting the asset for that selected area. The light grey percentages on either end of the chart indicate the rates for the areas with the lowest and highest percentages of children reporting the presence of the asset for the selected grade and year.
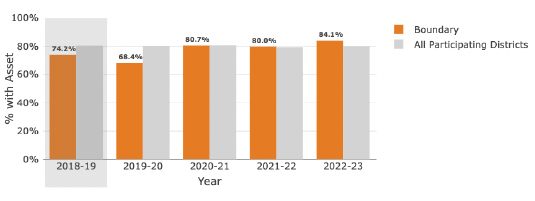
Asset over Time Chart View: Asset over time — Shows the percentage of children who report the presence of the selected asset over time in a specific area for the selected grade and year. The grey comparison bars represent the average for the boundary type selected. If the boundary type selected is “School District,” the grey bar represents the average for All Participating Schools. If the boundary type selected is “Neighbourhood,” the grey bars represent the school district average.
A NOTE ABOUT THE OUT-OF-SCHOOL ACTIVITIES ASSET: In the 2022/23 reporting year, the MDI questionnaire was changed to ask children about their activities outside of school hours. In previous years, children were asked about their activities only during the hours of 3 pm to 6 pm on school days. As a result, the Out-of-School Activities Asset data are not comparable to the After-School Activities Asset data from previous years.
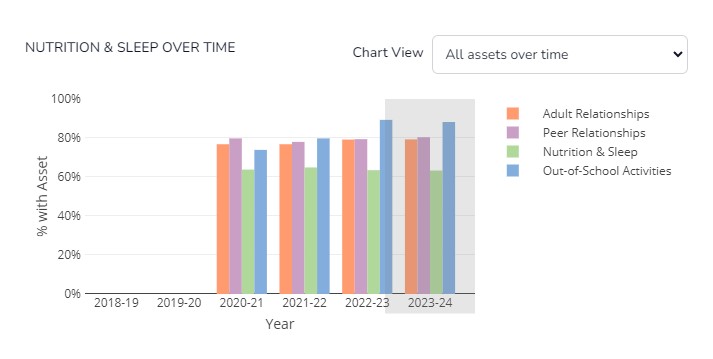
Asset over Time Chart View: All assets over time — Shows the percentage of all four assets in one chart view. Use the legend to the right of the chart to toggle each asset off and on.
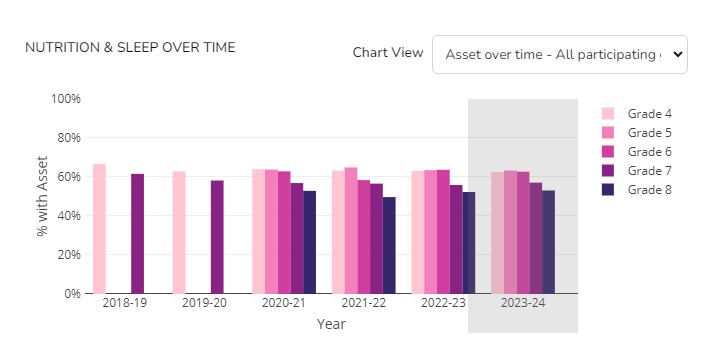
Asset over Time Chart View: All participating grades over time chart — Shows the percentage of children reporting the presence of the selected asset over time for all participating grades in a specific area for the selected grade and year. Use the legend to the right of the chart to toggle each grade off and on.
Component Measures: Asset Index – The Component Measures section highlights the measures that make up the selected Asset Index. The measures within each Asset vary depending on the Asset selected. The Chart View drop-down offers additional options to view the data. By default, the “High score over time” chart view is selected.
Additional chart views to choose from within the Component Measure section include:
- Component Measures Chart View: Outcomes over time — Shows the high (green), medium (yellow) and low (red) outcomes* for the selected component measure over time.
- Component Measures Chart View: All measures over time — Shows the percentage of children with a high score* for all measures in the selected index.
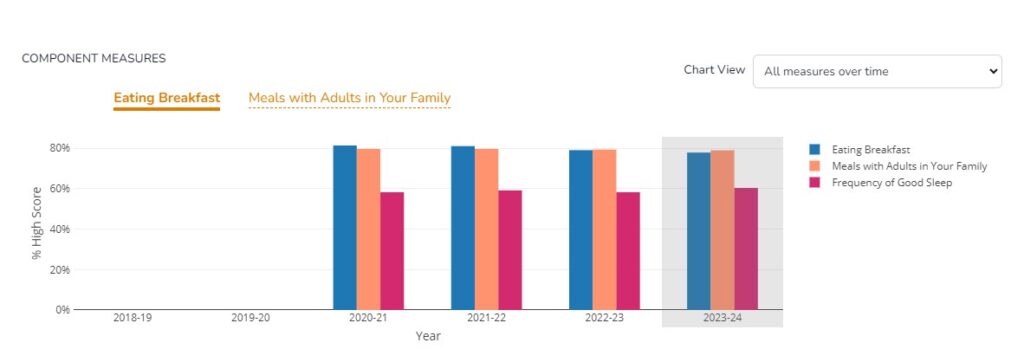
*Note about high scores and outcomes: Not all outcomes for MDI measures are scored as “high,” “medium,” and “low.” For example, the Eating Breakfast measure reports the frequency or number of times children eat breakfast in a week. More information can be found above under the “MDI in Brief” title.
- Component Measures Chart View: All participating grades – Shows the high (green), medium (yellow) and low (red) outcomes for the selected component measure across all participating grades for the selected school year.
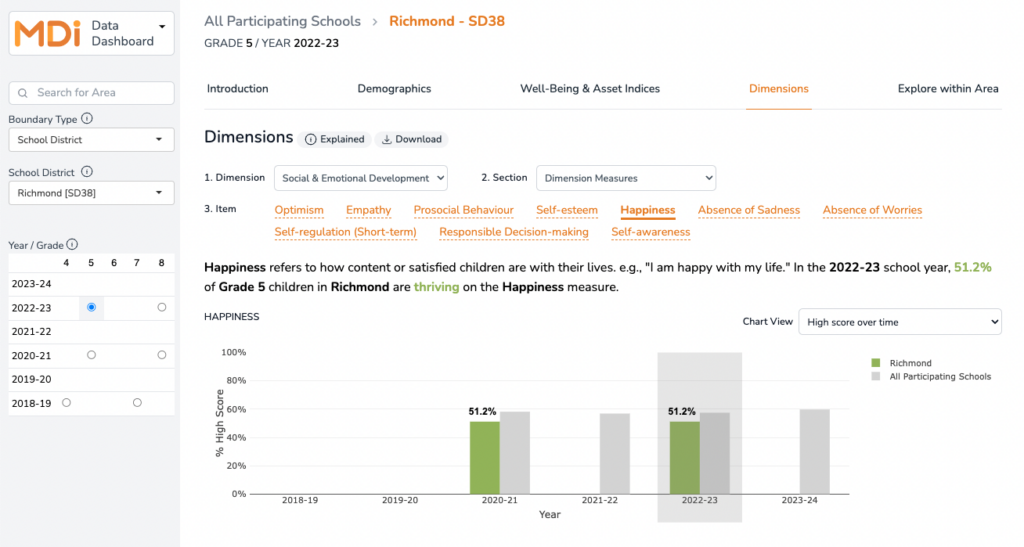
Module: Dimensions
The MDI uses a strengths-based approach to assess five areas of development, or dimensions, that are strongly linked to well-being, health, and academic achievement. The MDI provides a holistic picture of how children in the middle years are doing at school, at home, and in their community.
NOTE: The MDI Data Dashboard does not report on the measures and items in the School Experiences dimension. Data that make up the School Experiences dimension are available to view on MDI School District Reports. The Dimensions module allows users to explore more granular data at the measures and individual item level. Each MDI dimension is made up of measures and individual items related to that dimension. Measures are made up of a collection of responses from the questionnaire
KEY CONCEPTS IN THIS MODULE
- Dimension – an area of development assessed in the MDI that are strongly linked to well-being, health and academic achievement, and provide a holistic picture of how children in the middle years are doing at school, at home, and in their community.
- Measure – made-up of a collection of responses from the MDI questionnaire related to that measure.
- Individual items – questions from the MDI questionnaire that are reported and do not contribute to a measure or an index, but provide additional insight into children’s thoughts and opinions on timely issues.
For more information on what questions contribute to each measure on the MDI, please refer to the MDI Companion Guide for more detail.
To get started with this module, follow the numbered steps find the data you wish to explore:
- Dimension – First, select one of the four available dimensions from the Dimension drop-down. Note: Data for the School Experiences dimension are not reported on the Dashboard. For more information on the dimensions of the MDI, visit Discover MDI.
- Section – Next, select from available sections. Section are groupings of related data. For example, the Dimension Measures section consist of all the measures that make up the selected Dimension. Other sections may be grouped by a theme such as “Concern for the Environment” or “Wake up & Bed time”

- Item – Finally, select from available items within the selected section to explore data. Switching between items will update the charts to the selected item.
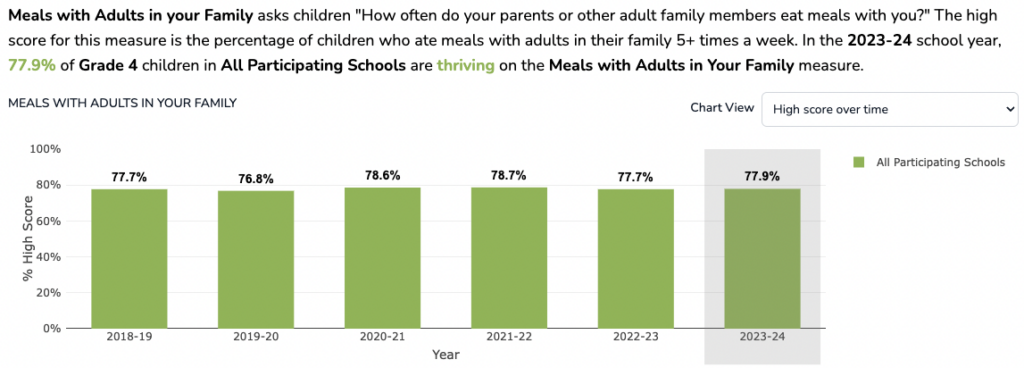
Use the chart view drop-down to select between available chart views. Chart views will vary depending on the section or item selected. A short description of the item will appear for the selected item and for some items, a key takeaway summary about the data is provided. The example below shows the Meals with Adults in your Family item with description and key takeaway summary on the data:
CHARTS IN THIS MODULE
Charts in this module are categorized as either trend charts or point-in-time charts. Chart views will vary depending on the section or item selected.
Trend Charts show data over time and allow users to see patterns in the data over the short-term and long-term. Examples of trend charts available to view in this module include:
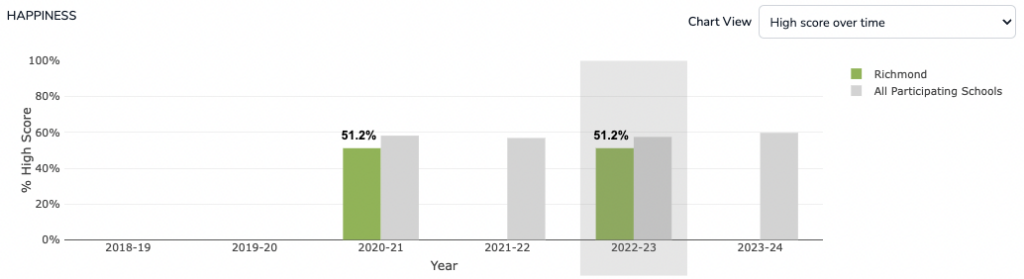
- Thriving over time: This chart view is only available for items in the Dimension Measures section. The green bars show the percentage of children who are thriving over time in the selected item for the selected area and grade. The grey bar represents the average for the boundary type selected. For example, if the boundary type selected is “School District,” the grey bar represents the average for all participating schools. If the boundary type selected is “Neighbourhood,” the grey bar represents the school district average.
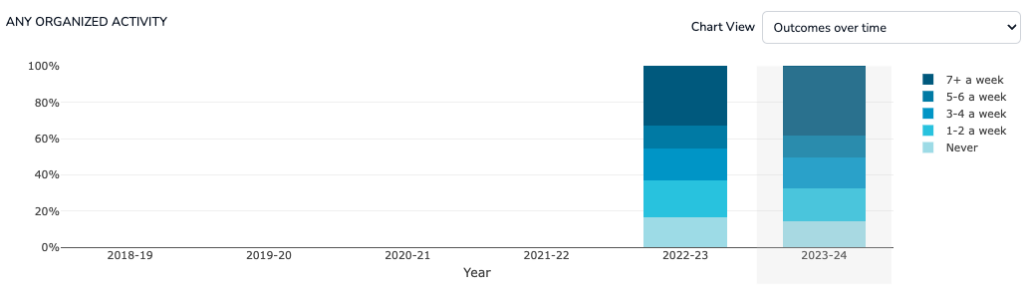
- Outcomes over time: Shows the percentage of children who are thriving or have high (green), medium (yellow), and low (red) scores. Charts may also show a wider range of categories, such as in the example below which shows frequency:
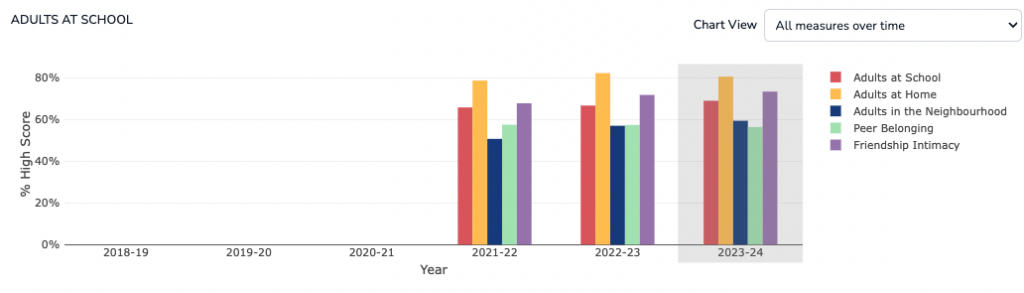
- All measures over time: Shows the percentage of children who are thriving or have high scores over time for a selected item against other items for the selected area and grade. This view is only available when Dimension Measures is selected under Section. The chart legend may be used to activate or deactivate items within the chart.
- High score over time – all participating grades: Shows the percentage of children who have high scores over time for a selected item across all participating grades.
Point-in-Time charts show data for the selected year only. Examples of trend charts available to view in this module include:
- All participating grades: Shows the outcomes for the selected item across participating grades for the selected area and year. Depending on the item selected, outcomes may be reported as high (green), medium (yellow), or low (red) or in a wider range of categories:
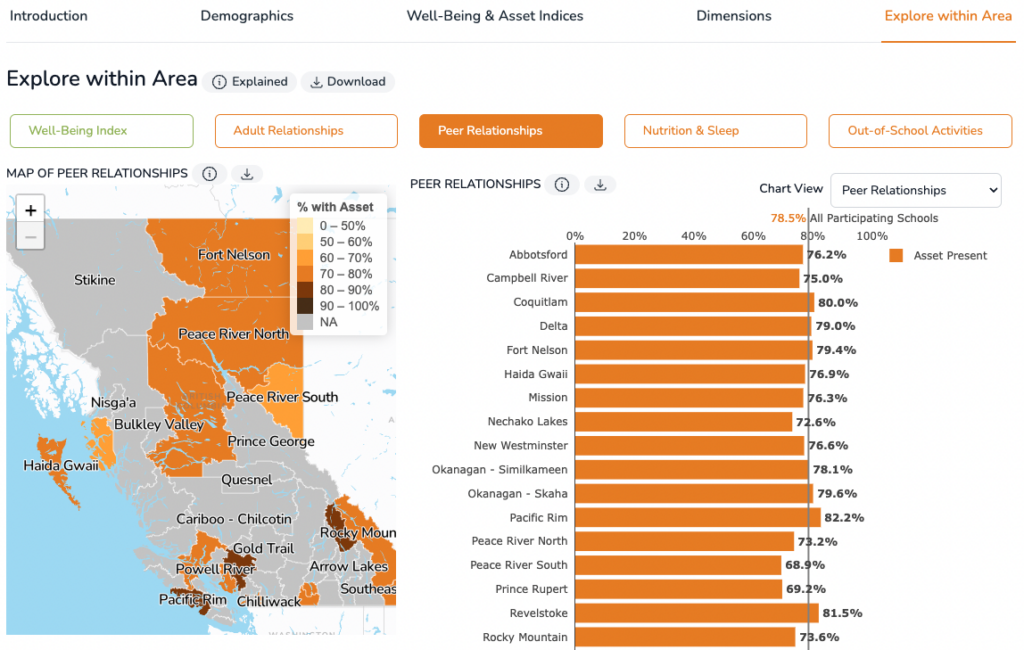
Module: Explore within Area
This module highlights the data of sub-regions within a boundary type selected. Select from the Well-Being Index or one of the four assets of the Assets Index to see data for All Participating Schools or All Neighbourhoods within a school district for the selected grade and year.
Note: Some smaller school districts do not have neighbourhood sub-regions. In this case, the message “There are no data available for the selected area” will appear under the Explore within Area module title.
The following section explains the available chart views when the Well-Being Index is selected:
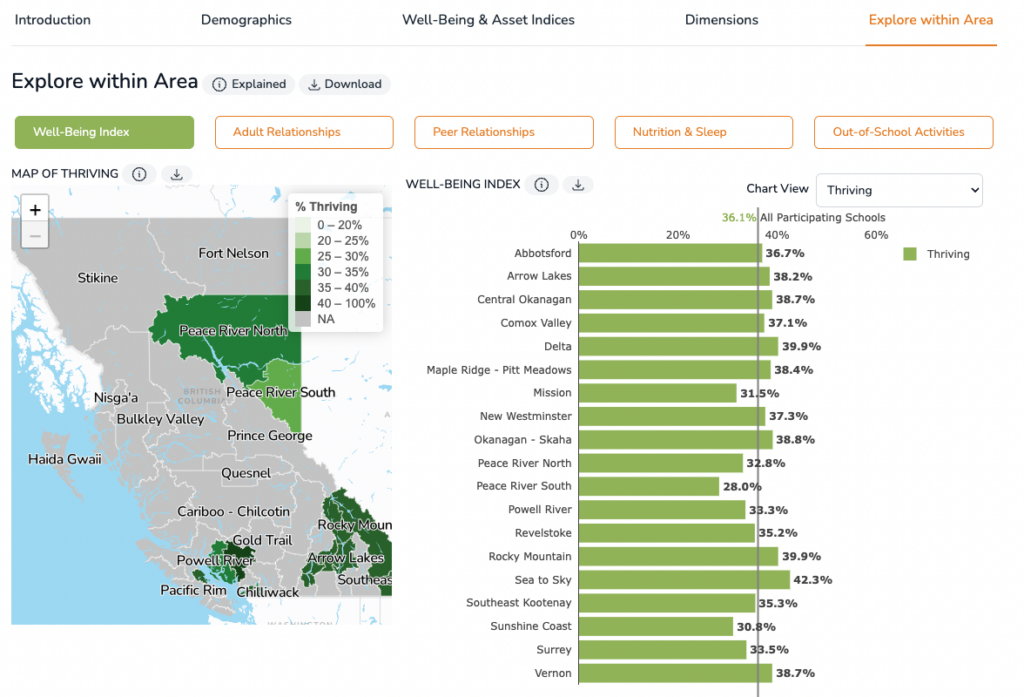
MAPS & CHARTS IN THIS MODULE — WELL-BEING INDEX VIEW
Map of Thriving — Shows the percentage of children who are thriving for the sub-regions of the area and the grade and year selected. Refer to the legend to interpret the variability of colour on each map. Use the zoom feature (+ and – control) to expand or narrow down a view. Hovering on areas of the map to reveal more data and clicking on an area of the map will select it and refresh the Dashboard to data for that selected area.
Thriving Chart (Explore within Module) — Shows the thriving rates for the sub-regions of the area and grade and year selected. The vertical grey line represents the average for the selected area.
Well-Being Index All Outcomes Chart (Explore within Module) — Shows the outcome or percentage of children reporting thriving or high (green), medium (yellow), and low (red) well-being for the sub-regions of the area and selected grade and year selected.
The following section explains the available chart views when an Asset is selected:
MAPS & CHARTS IN THIS MODULE – ASSETS INDEX VIEW
Map of Asset — Shows the percentage of children reporting the presence of the chosen asset for the sub-regions of the area and grade and year selected. Refer to the legend to interpret the variability of colour on each map. Use the zoom feature (+ and – control) to expand or narrow down a view. Hovering on areas of the map to reveal more data and clicking on an area of the map will select it and refresh the Dashboard to data for that selected area.
Asset Chart (Explore within Module) — Shows the percentage of children reporting the selected asset for the sub-regions of the area and grade and year selected. The vertical grey line represents the average for the selected area.
Additional Resources
Helpful resources for using the MDI Data Dashboard can be found in this module. Along with this Technical Guide, viewers will find:
- MDI Overview – Learn more about the Middle Years Development Instrument (MDI) including information on data collection and key MDI contacts.
See MDI overview - DiscoverMDI – Find information and helpful resources for using MDI data in school districts and across communities – PowerPoint slides, workshop resources, research briefs, examples of MDI data in action and more.
See DiscoverMDI - MDI Provincial Summary – At the end of each year of MDI data collection, HELP makes available resources that provide an overview of the trends across grades for “All Participating Districts”.
View the most recent MDI Trends Webinar - MDI Reports – PDF versions of MDI School District Reports for the last three school years are available on the HELP Website. These reports include Well-Being and Assets Indices data, along with more detailed data about the component measures of the Indices, school experiences, active transportation and much more.
View Reports
Feedback & Technical Issues
The MDI Data Dashboard is a new HELP reporting approach. We want to hear about your experience using the Dashboard. Please click below to provide feedback, or report any technical issues that you encounter with the performance or functionality about the dashboard.
Provide Feedback Report Technical Issues