Decades of research have demonstrated that children's first years of development are profoundly important to their lifelong health and well-being. In fact, early childhood development is itself a social determinant of health – influencing physical and mental health, learning and social outcomes over the life course and across generations.1,2
The Human Early Learning Partnership (HELP, UBC) collects data through the Early Development Instrument (EDI) and other Child Development Monitoring System tools in BC with the intent to “shine the light” on how children are doing and inspire action to promote healthy development and well-being. Wave 8 (data collected 2019-2022) marks 20 years of EDI data collection in BC. This report provides a foundational summary of EDI data across these last two decades, setting the stage for more analysis and research to come. New to the EDI? Learn more about the EDI, how data are collected and its impact over the last 20 years
EDI Wave 8: Key Findings
Still 1 in 3
In Wave 8, 32.9% (approximately 13,500) of kindergarten children were vulnerable on one or more areas critical to their healthy development. Wave 8 is the fifth provincial EDI data collection in a row where more than 30% of children were vulnerable. Almost two decades of research have demonstrated the predictive capability of EDI vulnerability: without additional support and care, children who are vulnerable on one or more scales of the EDI (overall vulnerability) are more likely to experience future challenges in their school years and beyond. With this, the level of overall vulnerability has significant social and economic cost to BC, not only as children start school but throughout their lives.
Social & Emotional Development Remain Highest Areas of Concern
For the third wave in a row, the two EDI scales with the highest vulnerability rates continue to be Emotional Maturity and Social Competence. This is particularly concerning given that these scales measure behaviours that relate to the most common childhood mental health issues. Indeed, these findings are consistent with other studies that show increased incidences of mental health concerns with young children across Canada.3,4
Geographic Differences
As with past waves, Wave 8 EDI data revealed large differences in overall vulnerability rates across regions of BC. At the school district level, overall vulnerability rates ranged from 21.8% at the lowest end to 72.0% at the highest. Additionally, there were only two neighbourhoods with overall vulnerability rates of 15% or lower, but 27 with rates of 45% or higher. These data provide an important lens on the topography of inequities that children and families across BC continue to face.
EDI Data Collection
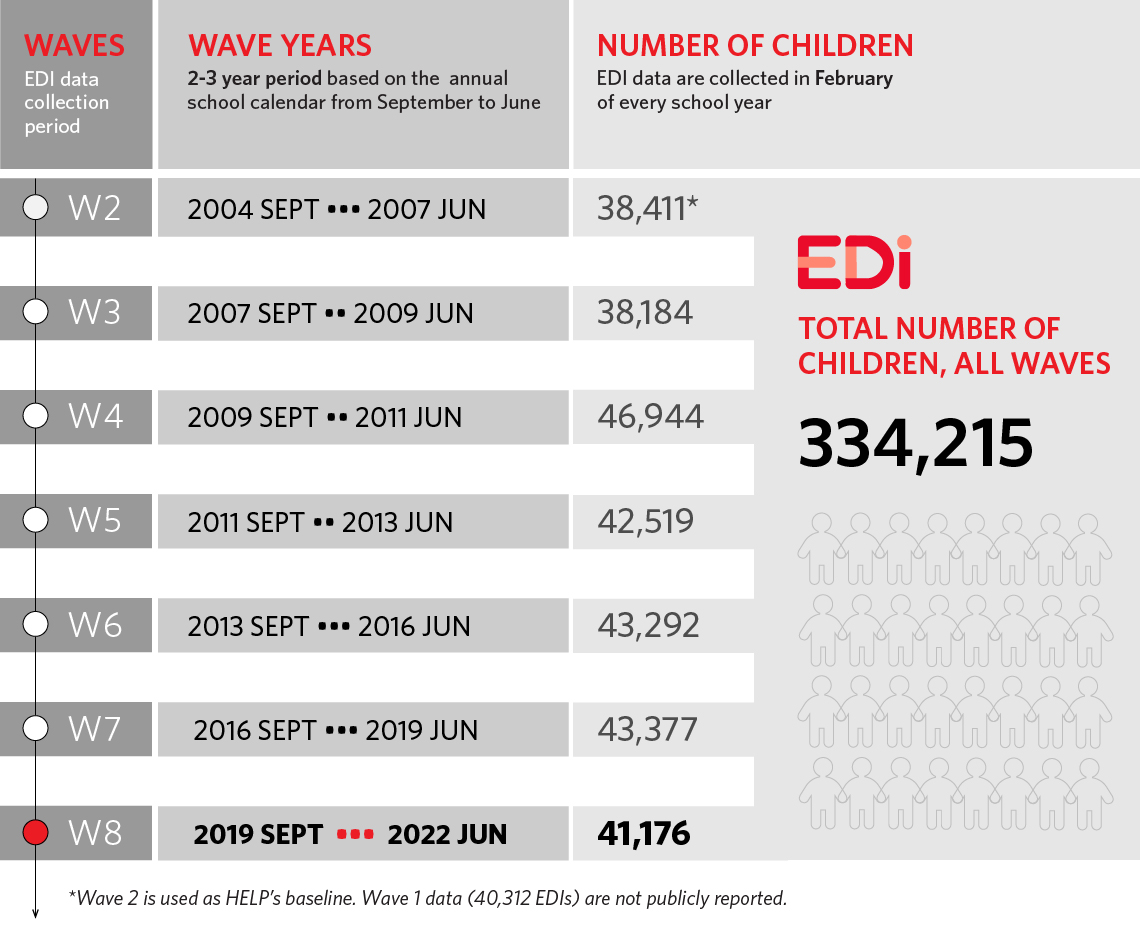
In BC, the Human Early Learning Partnership (HELP, UBC) has been collecting EDI data province-wide since 1999, gathering data for over 330,000 kindergarten children in the last two decades. EDI data are collected on a three-year schedule called a “wave” to capture sufficient data in all school districts involved in the province. The EDI questionnaire is completed by kindergarten teachers in participating school districts in February of the school year for each of the children in their classroom. Data for over 41,000 children attending kindergarten were collected during Wave 8. View the EDI's Data Collection History
Participation and Demographics
The participation rate for Wave 8 was 88% of children enrolled in participating districts and schools. This rate is consistent with rates seen in earlier waves of data collection. The EDI wave participation rate is the percentage of kindergarten children enrolled in the school districts involved in EDI data collection for whom an EDI questionnaire was completed. EDI data are collected in 57 BC school districts and some participating independent and First Nations schools.
EDI Participation and Demographic Summary
| Wave 2 | Wave 3 | Wave 4 | Wave 5 | Wave 6 | Wave 7 | Wave 8 | |
|---|---|---|---|---|---|---|---|
| Total EDI | 38,411 | 38,184 | 46,944 | 42,519 | 43,292 | 43,377 | 41,176 |
| Male | 19,806 | 19,683 | 24,160 | 21,666 | 22,259 | 22,260 | 21,104 |
| Female | 18,603 | 18,492 | 22,784 | 20,853 | 21,033 | 21,117 | 20,072 |
| ELL | 7,111 | 6,974 | 8,193 | 7,602 | 8,147 | 8,356 | 8,244 |
| Special Needs | 1,295 | 1,198 | 1,448 | 1,322 | 1,438 | 1,680 | 1,838 |
| Wave 2 | Wave 3 | Wave 4 | Wave 5 | Wave 6 | Wave 7 | Wave 8 | |
|---|---|---|---|---|---|---|---|
| Total EDI | 38,411 | 38,184 | 46,944 | 42,519 | 43,292 | 43,377 | 41,176 |
| Male | 51.6% | 51.6% | 51.5% | 51.0% | 51.4% | 51.3% | 51.3% |
| Female | 48.4% | 48.4% | 48.5% | 49.0% | 48.6% | 48.7% | 48.7% |
| ELL | 18.7% | 18.5% | 17.5% | 17.9% | 18.8% | 19.3% | 20.0% |
| Special Needs | 3.4% | 3.2% | 3.1% | 3.1% | 3.3% | 3.9% | 4.5% |
©Human Early Learning Partnership, UBC - 2022
Overall Vulnerability
In Wave 8, 32.9%, or approximately 13,500 of kindergarten children, were vulnerable on one or more scales of the EDI (overall vulnerability). This rate is similar to the Wave 7 (collected 2016-2019) rate of 33.4%. This means that there are still 1 in 3 children arriving in kindergarten vulnerable on one or more areas of development important to their future success.
There has been a meaningful increase in EDI overall vulnerability rates over the long-term, rising from 29.9% in Wave 2 to 32.9% in Wave 8. While there was a small decrease in the rate between Wave 7, at 33.4% and Wave 8 (32.9%), this difference does not meet the threshold to signal a meaningful change. What do we mean by meaningful change?
Meaningful Change
HELP’s definition of meaningful change is based on Critical Difference, which is a statistical method for determining when two scores (e.g., an area’s EDI vulnerability rate over two time periods) are different enough to be “worth talking about.” This mean that we are reasonably confident that the difference is real, rather than the result of uncertainty due to measurement issues. We consider both statistical significance and practical significance when interpreting meaningful change, and limit our reporting of meaningful change to long-term and short-term trends, using the following symbols in the report:
LT Long-term Trend - Wave 2 to Wave 8
ST Short-term Trend - Wave 7 to Wave 8

Meaningful Increase

Stable Trend

Meaningful Decrease
Long-term
Trend
(LT)(Wave 2-8)
Short-term
Trend
(ST)(Wave 7-8)
Mulitiple Vulnerabilities in BC
While many of the province's children were vulnerable on a single area of development, some were vulnerable on two, three, four or all five areas of development measured by the EDI.
Over the long-term, the percentage of children vulnerable on two or more areas of development increased from 16.1% in Wave 2 to 19.5% in Wave 8. In Wave 8, this percentage represents over 8,000 children vulnerable on multiple areas of development (two or more scales of the EDI).
This suggests that in addition to increased rates of overall vulnerability in BC over the long-term, the complexity of vulnerability also increased. It appears that children and families experienced more complex challenges and vulnerable children had increased struggles across more areas of their lives.
New Overall Outcomes
In past EDI data reporting, the focus has been on highlighting rates of developmental vulnerability in populations of children. However, the EDI measures the whole distribution of children's outcomes, allowing us to understand areas of strength and potential across the five key areas of development. Discover more about the new metrics in the EDI.
Five Scales of the EDI


Scale-level Outcomes
The percentage of children vulnerable, at risk, or on track on the specific area of development the scale is measuring.
Vulnerable
Below the 10%
cut-off score.
At Risk
Between the 10% - 25%
cut-off scores
On Track
Above the 25%
cut-off score
Overall Outcomes
The percentage of children vulnerable, in flux, or on track in their overall development across all five scales of the EDI.
Vulnerable
on one or more scales.
In Flux
Not vulnerable or on track on any scale.
On Track
on all scales
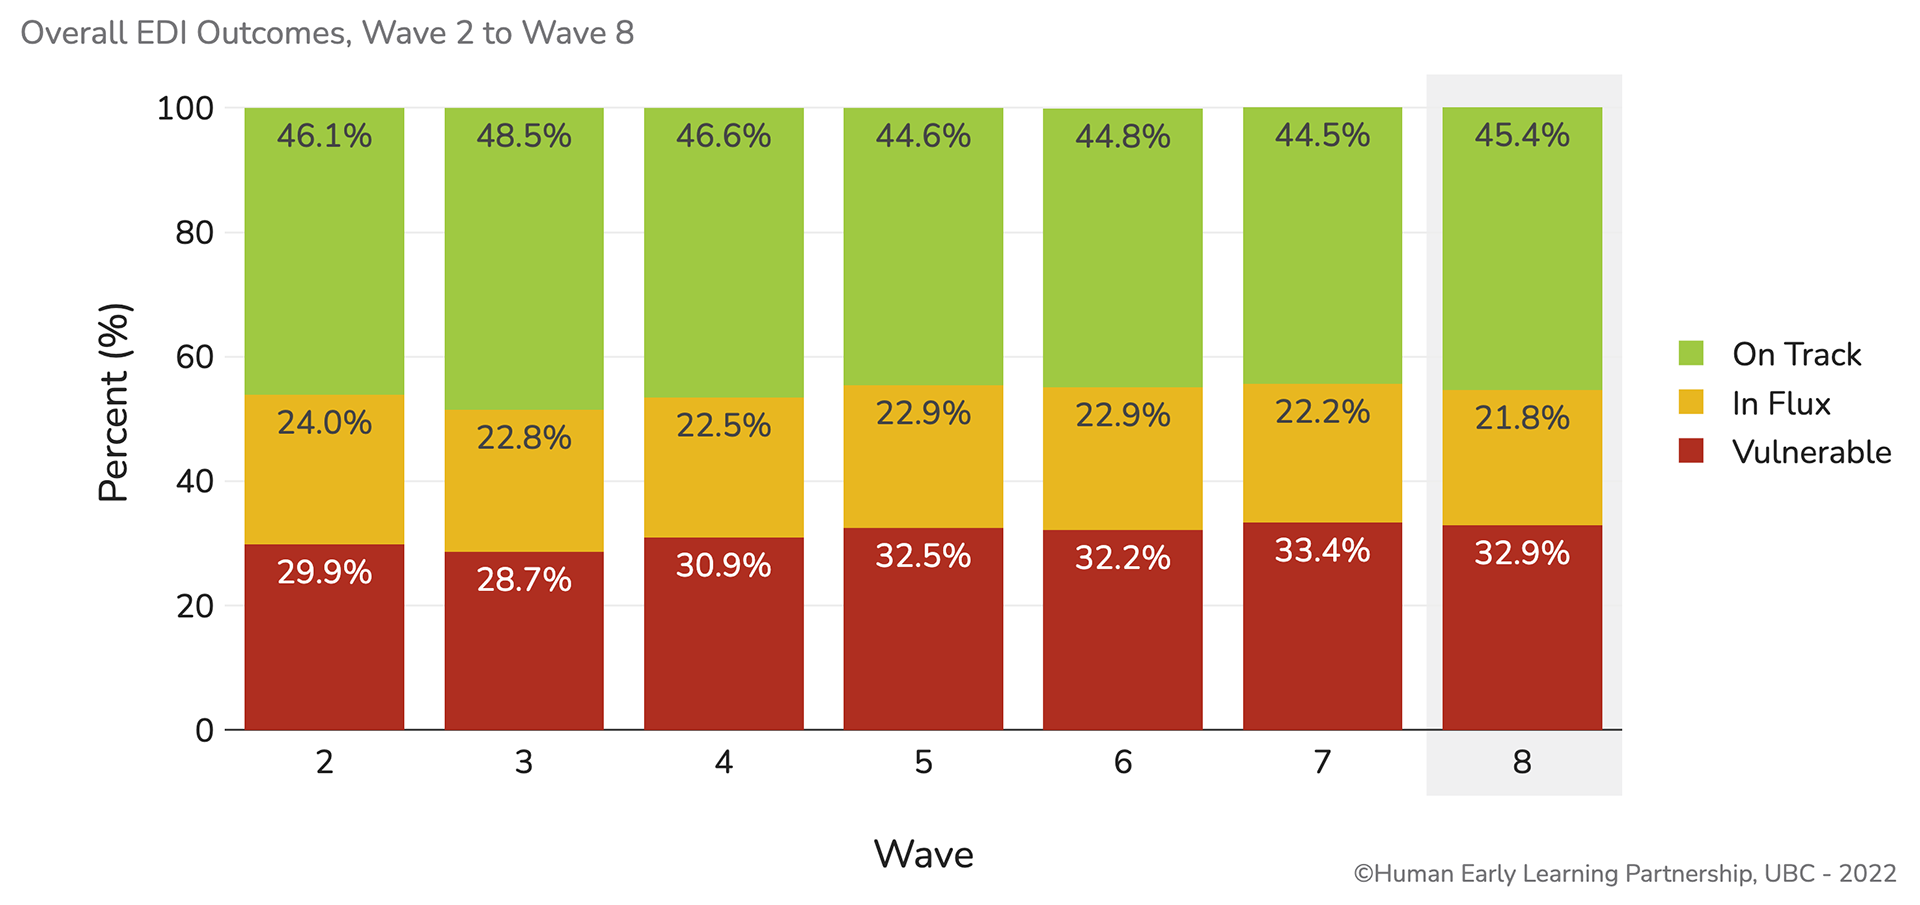
The bar chart above shows the trends over time for the percentage of children in BC that were overall on track, in flux and vulnerable on the EDI from Wave 2 to Wave 8. In Wave 8, while almost half of children (45.4%) were on track in all five areas of development, 32.9% were vulnerable in one or more areas of development and another 21.8% were in flux.
Vulnerability across the Province
Wave 8 Vulnerability in School Districts in BC
The map below illustrates overall vulnerability rates for Wave 8 by BC school district boundaries. It is evident that there continues to be significant differences in overall vulnerability rates across the province, demonstrating that children's developmental outcomes are influenced by where they live.
Vulnerable on One or More Scales
Range in School District Vulnerability
21.8% - 72.0%
NOTE: Additional School District level data will be released in early 2023 in our new dashboard alongside data from other geographic aggregations
The Disparity in Vulnerability:
The Range in Neighbourhood Vulnerability across BC
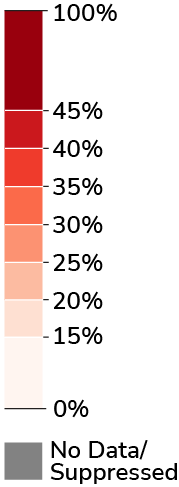
Disparities in overall vulnerability rates were even more pronounced at the neighbourhood level. In Wave 8, there was more than a five-fold difference between the neighbourhood with the lowest overall vulnerability rate of 13.2% to the highest at 72.0%. The chart below shows how the range in overall vulnerability changed over time. Each red dot on the chart represents one of the 298 HELP neighbourhoods for BC and where it falls in the range of overall vulnerability. Notably, over the past four waves, overall vulnerability rates increased at both the lowest and highest ends of the range.
Range of Neighbourhood Outcomes in Wave 8
Vulnerable
13.2% - 72.0%
In Flux
9.5% - 33.3%
On Track
7.5% - 71.4%
©Human Early Learning Partnership, UBC - 2022
The Shifting Curve
More Neighbourhoods with High Overall Vulnerability
The shift to higher overall vulnerability across neighbourhoods in BC is evidenced by the data in the table below. The table shows the number of neighbourhoods that had overall vulnerability rates of 15% or less (low rates) compared to the number of neighbourhoods with rates of 45% or higher (high rates) for each wave of EDI data collection, from 2004 to 2022. As can be seen in the chart, the number of neighbourhoods with lower levels of overall vulnerability decreased, falling from a high of 25 neighbourhoods in Wave 3 to just two in Wave 8. There was also a decrease in the number of neighbourhoods with high overall vulnerability between Wave 7 (33) and Wave 8 (27).
Neighbourhoods with Overall Vulnerability 45% and above OR 15% and below, Wave 2 to Wave 8
| Wave 2 | Wave 3 | Wave 4 | Wave 5 | Wave 6 | Wave 7 | Wave 8 | |
|---|---|---|---|---|---|---|---|
| 45% and above | 27 | 19 | 24 | 23 | 26 | 33 | 27 |
| 15% and below | 22 | 25 | 7 | 7 | 6 | 5 | 2 |
©Human Early Learning Partnership, UBC - 2022
Comparing Urban and Rural Neighbourhoods
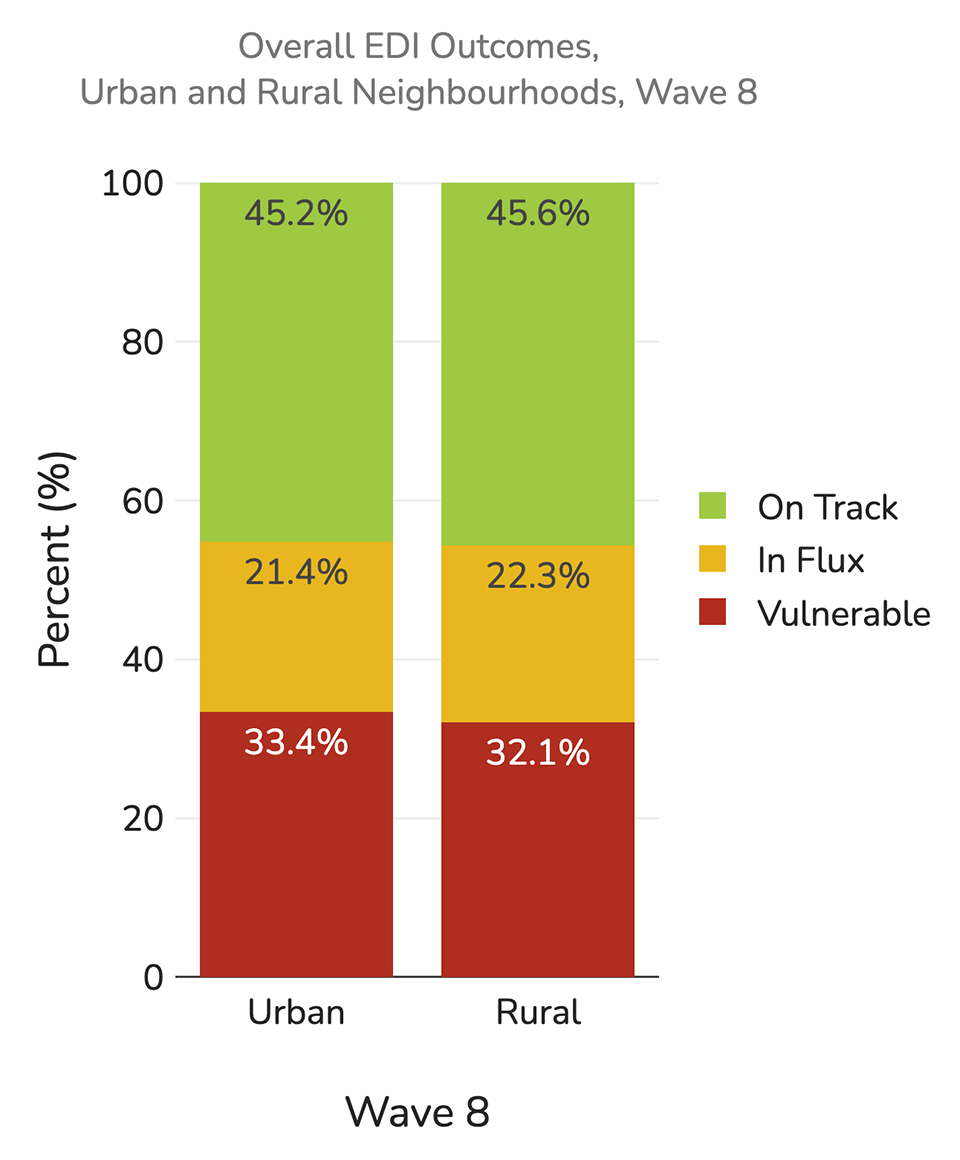
There was very little difference in Wave 8 between overall outcome rates for rural and urban neighbourhoods across the province. A neighbourhood is classified as urban if it has a population of at least 1,000 people and a population density of at least 400 people per square kilometre. Otherwise, it is rural. Children living in rural neighbourhoods have had consistently lower overall vulnerability rates than children living in urban neighbourhoods across all waves of the EDI; however, this difference has become smaller over time from about four percentage points in the earliest waves to just over one percentage point in recent waves.
EDI Scales and Subscales
While EDI overall outcomes provide a summary of the developmental health of kindergarten children, more specific information about each area of development can be found at the scale and subscale level. Each scale of the EDI also measures the whole distribution of children's development, identifying if children are on track, at risk, or vulnerable in that specific area of development. Find out more
EDI Scales & Subscale Measures
EDI scales measure the full distribution of children’s developmental outcomes. For each of the five EDI scales, children are classified as either on track, at risk or vulnerable based on their scores. EDI subscales also measure the full distribution of outcomes, for each of the 15 subscales. However, instead of classifying these scores, the subscale scores are standardized, which allows direct comparisons between subscales. Also, by using BC Wave 2 data as a baseline for the standardized scores, it is possible to track trends over time, noting if they are getting better or worse.
Social Competence
-
Overall Social Competence
- Ability to get along with other children, play with various children, cooperation and self-confidence.
-
Approaches to Learning
- Ability to work independently, solve problems, follow instructions and class routines, adjust to changes.
-
Readiness to Explore New Things
- Curiosity about the surrounding world, eagerness to explore new books, toys and games.
-
Respect & Responsibility
- Showing respect to others and property of others, self-control, ability to follow rules, take care of materials, accept responsibility.
Emotional Maturity
-
Aggressive Behaviour
- Aggressive behaviours, using aggression as means of solving conflict, temper tantrums, being mean to others.
-
Anxious & Fearful Behaviour
- Appearing fearful, anxious, worried, frequent crying, difficulty with separation from caregivers.
-
Hyperactivity & Inattentive Behaviour
- Hyperactive behaviours, distractible, difficulty waiting, impulsivity.
- Prosocial & Helping Behaviour
Physical Health & Well-being
-
Gross & Fine Motor Skills
- Physically able to tackle the school day and gross and fine motor skills.
-
Physical Independence
- Washroom independence, coordination, established hand preference and sucking thumb/fingers.
-
Physical Readiness for the School Day
- Dressed appropriately for school activities, coming to school tired, late or hungry.
Language & Cognitive Development
-
Basic Literacy
- Handling books, identifying some letters and letter sounds, awareness of rhyming words, writing direction.
-
Advanced Literacy
- Reading simple, complex words or sentences, writing simple words or sentences.
-
Basic Numeracy
- Counting to 20, comparing numbers, sorting and classifying, recognizing shapes.
-
Interest in Literacy, Numeracy &
Memory
- Interest in books and reading, numbers and math, and ability to remember things.
Communication Skills & General Knowledge
- No Subscales
Wave 8 Scale-level Outcomes
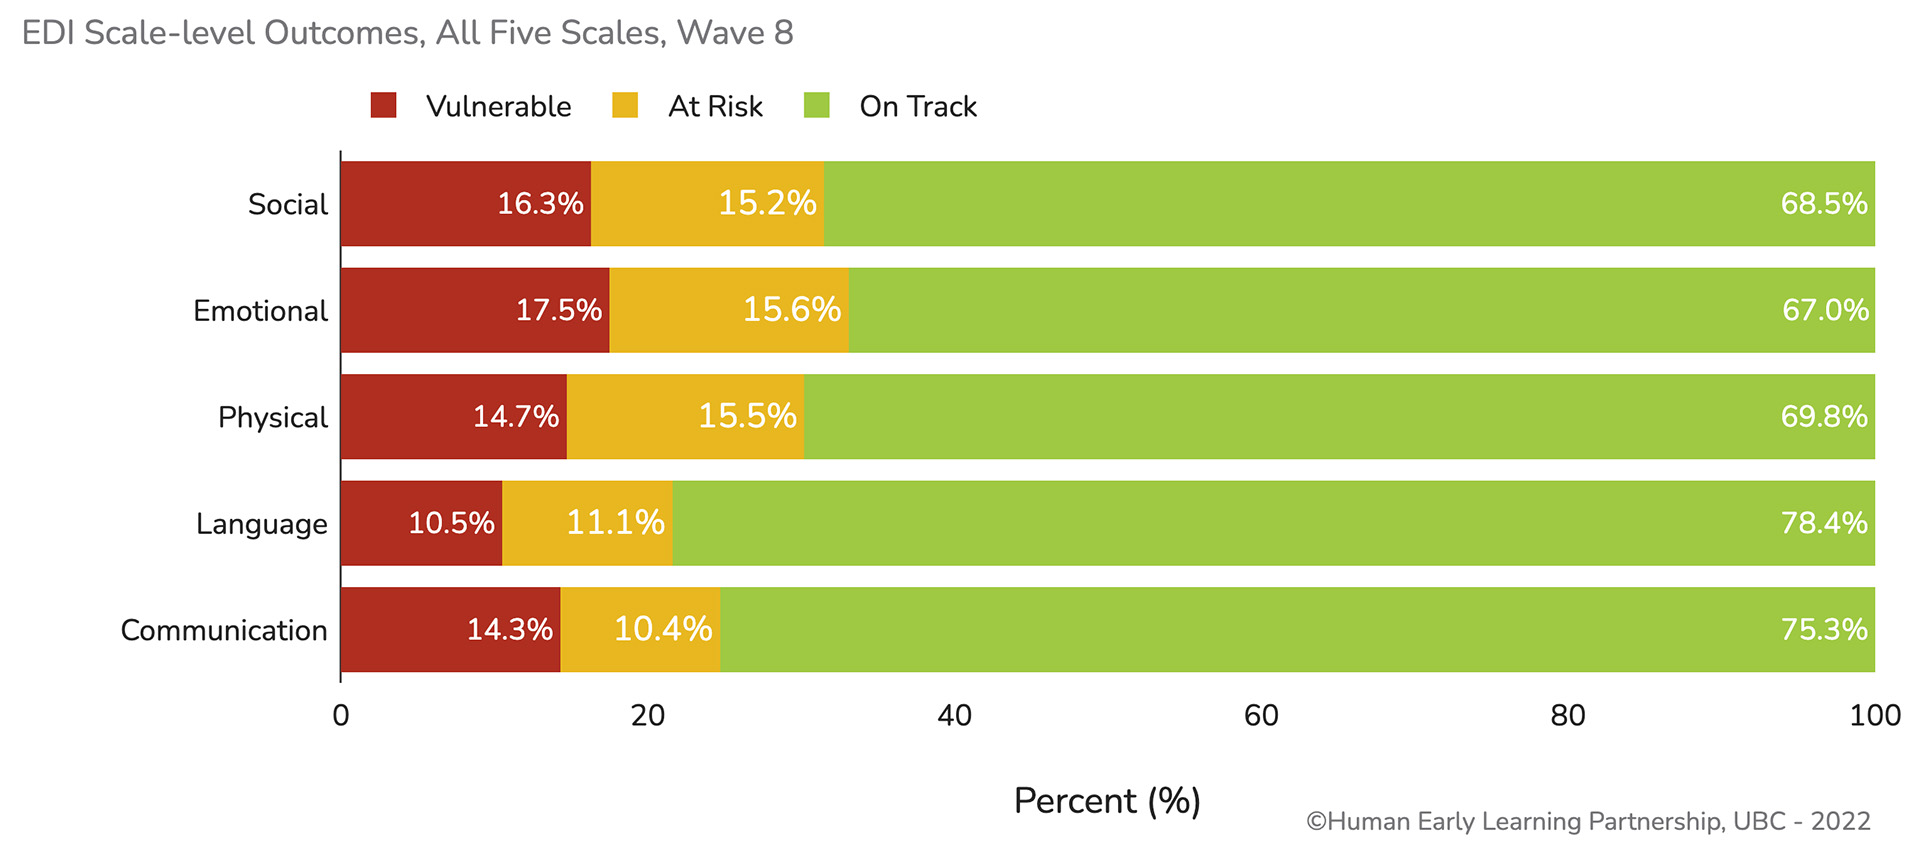
The chart below illustrates the percentage of children that were vulnerable, at risk, or on track on each of the five EDI Scales for Wave 8. Most children were on track in their development on each of the five scales, with 78.4% of children on track in Language & Cognitive Development, 75.3% in Communication Skills & General Knowledge, 69.8% in Physical Health & Well-being, 68.5% in Social Competence and 67.0% in Emotional Maturity. These data provide a more comprehensive picture of the five aspects of childhood development as measured by the EDI.
EDI Scale & Subscale-level Trends Over Time
Vulnerability
Vulnerability on All 5 Scales of the EDI
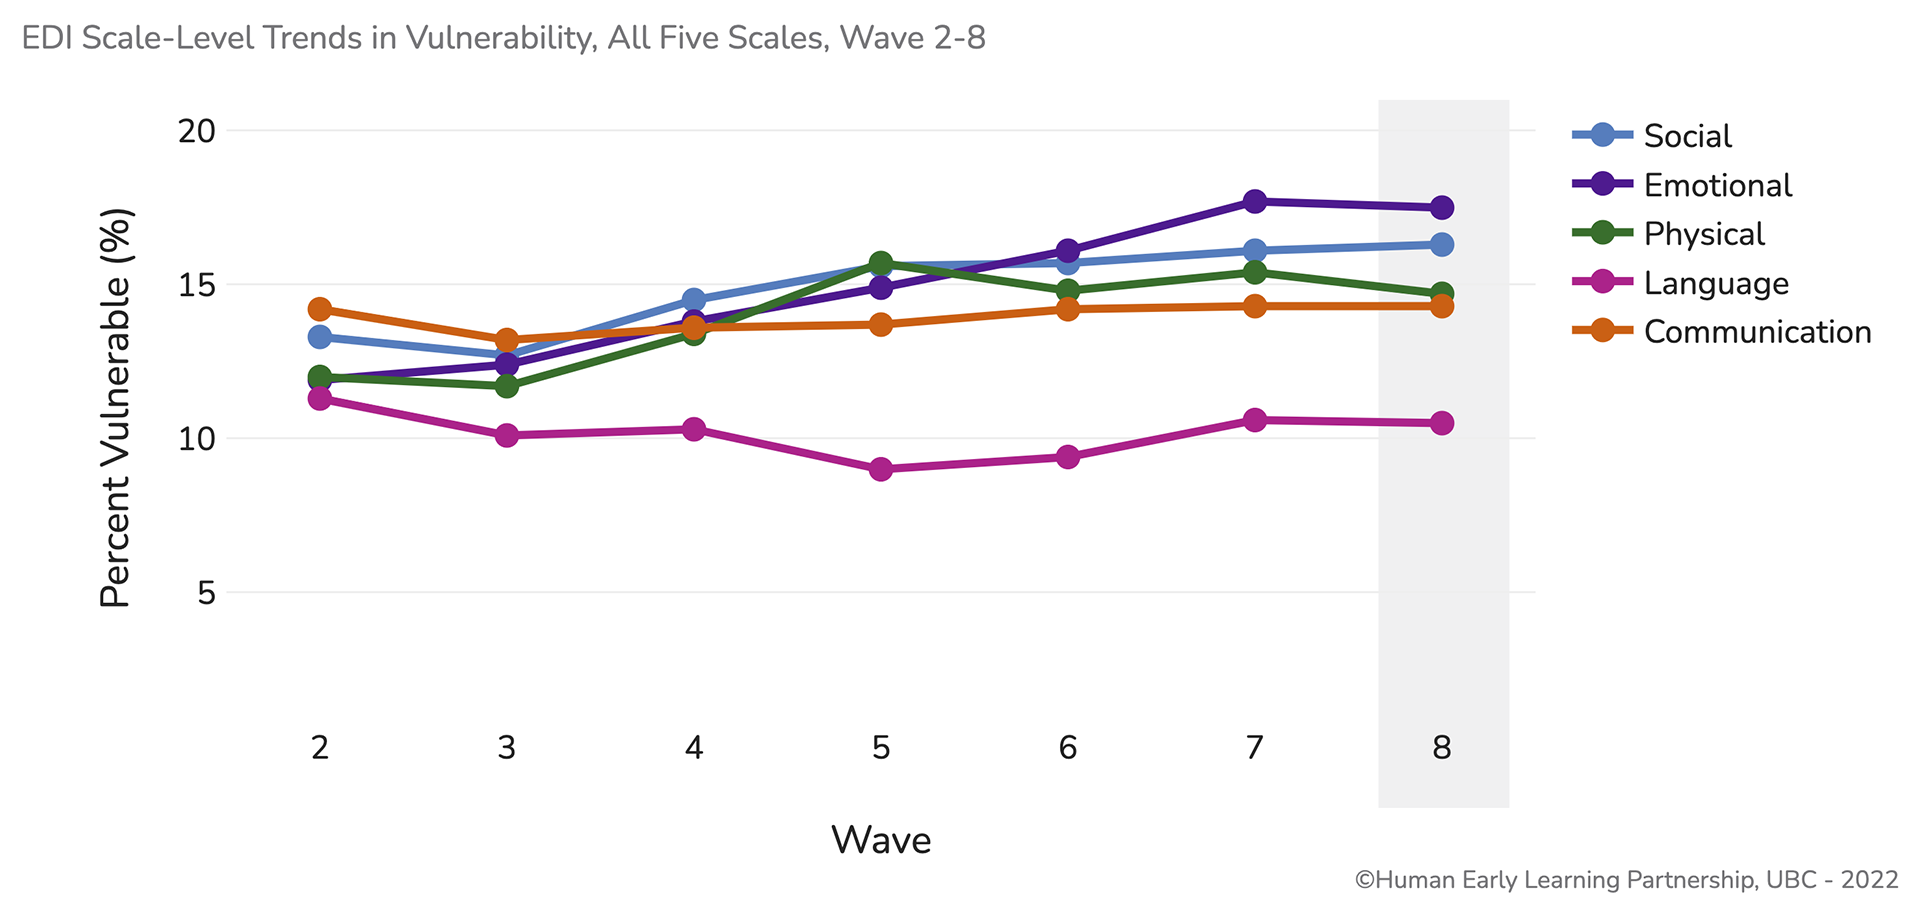
Exploring Scale and Subscale-level trends over time, especially long-term trends, can provide insight into which areas of development, in particular, are of most concern. The line chart below shows the trends in vulnerability over time from Wave 2 (2004-2007) to Wave 8 (2019-2022) on all five of the EDI scales. [Explore the trends for each of the scales, and their related subscales, by clicking on the scale of your choice.]
Long-term Vulnerability Trends: Between Wave 2 and Wave 8, three of the five EDI scales – Physical Health & Well-being, Social Competence and Emotional Maturity – had meaningful increases in vulnerability over the long-term. The other two scales – Language & Cognitive Development and Communication Skills & General Knowledge – had stable long-term trends.
Short-term Vulnerability Trends: All five scales had stable trends since the last data collection in Wave 7 (data collected 2016-2019). For the third wave in a row, the Emotional Maturity and Social Competence scales had the highest vulnerability rates of all five scales, at 17.5% and 16.3% respectively. These two scales are associated: Wave 8 data show that of the 8% of children who were vulnerable on two EDI scales, 42.5% were vulnerable on both Social Competence and Emotional Maturity scales combined. The developmental aspects assessed on these two scales represent indicators of children's early mental health.
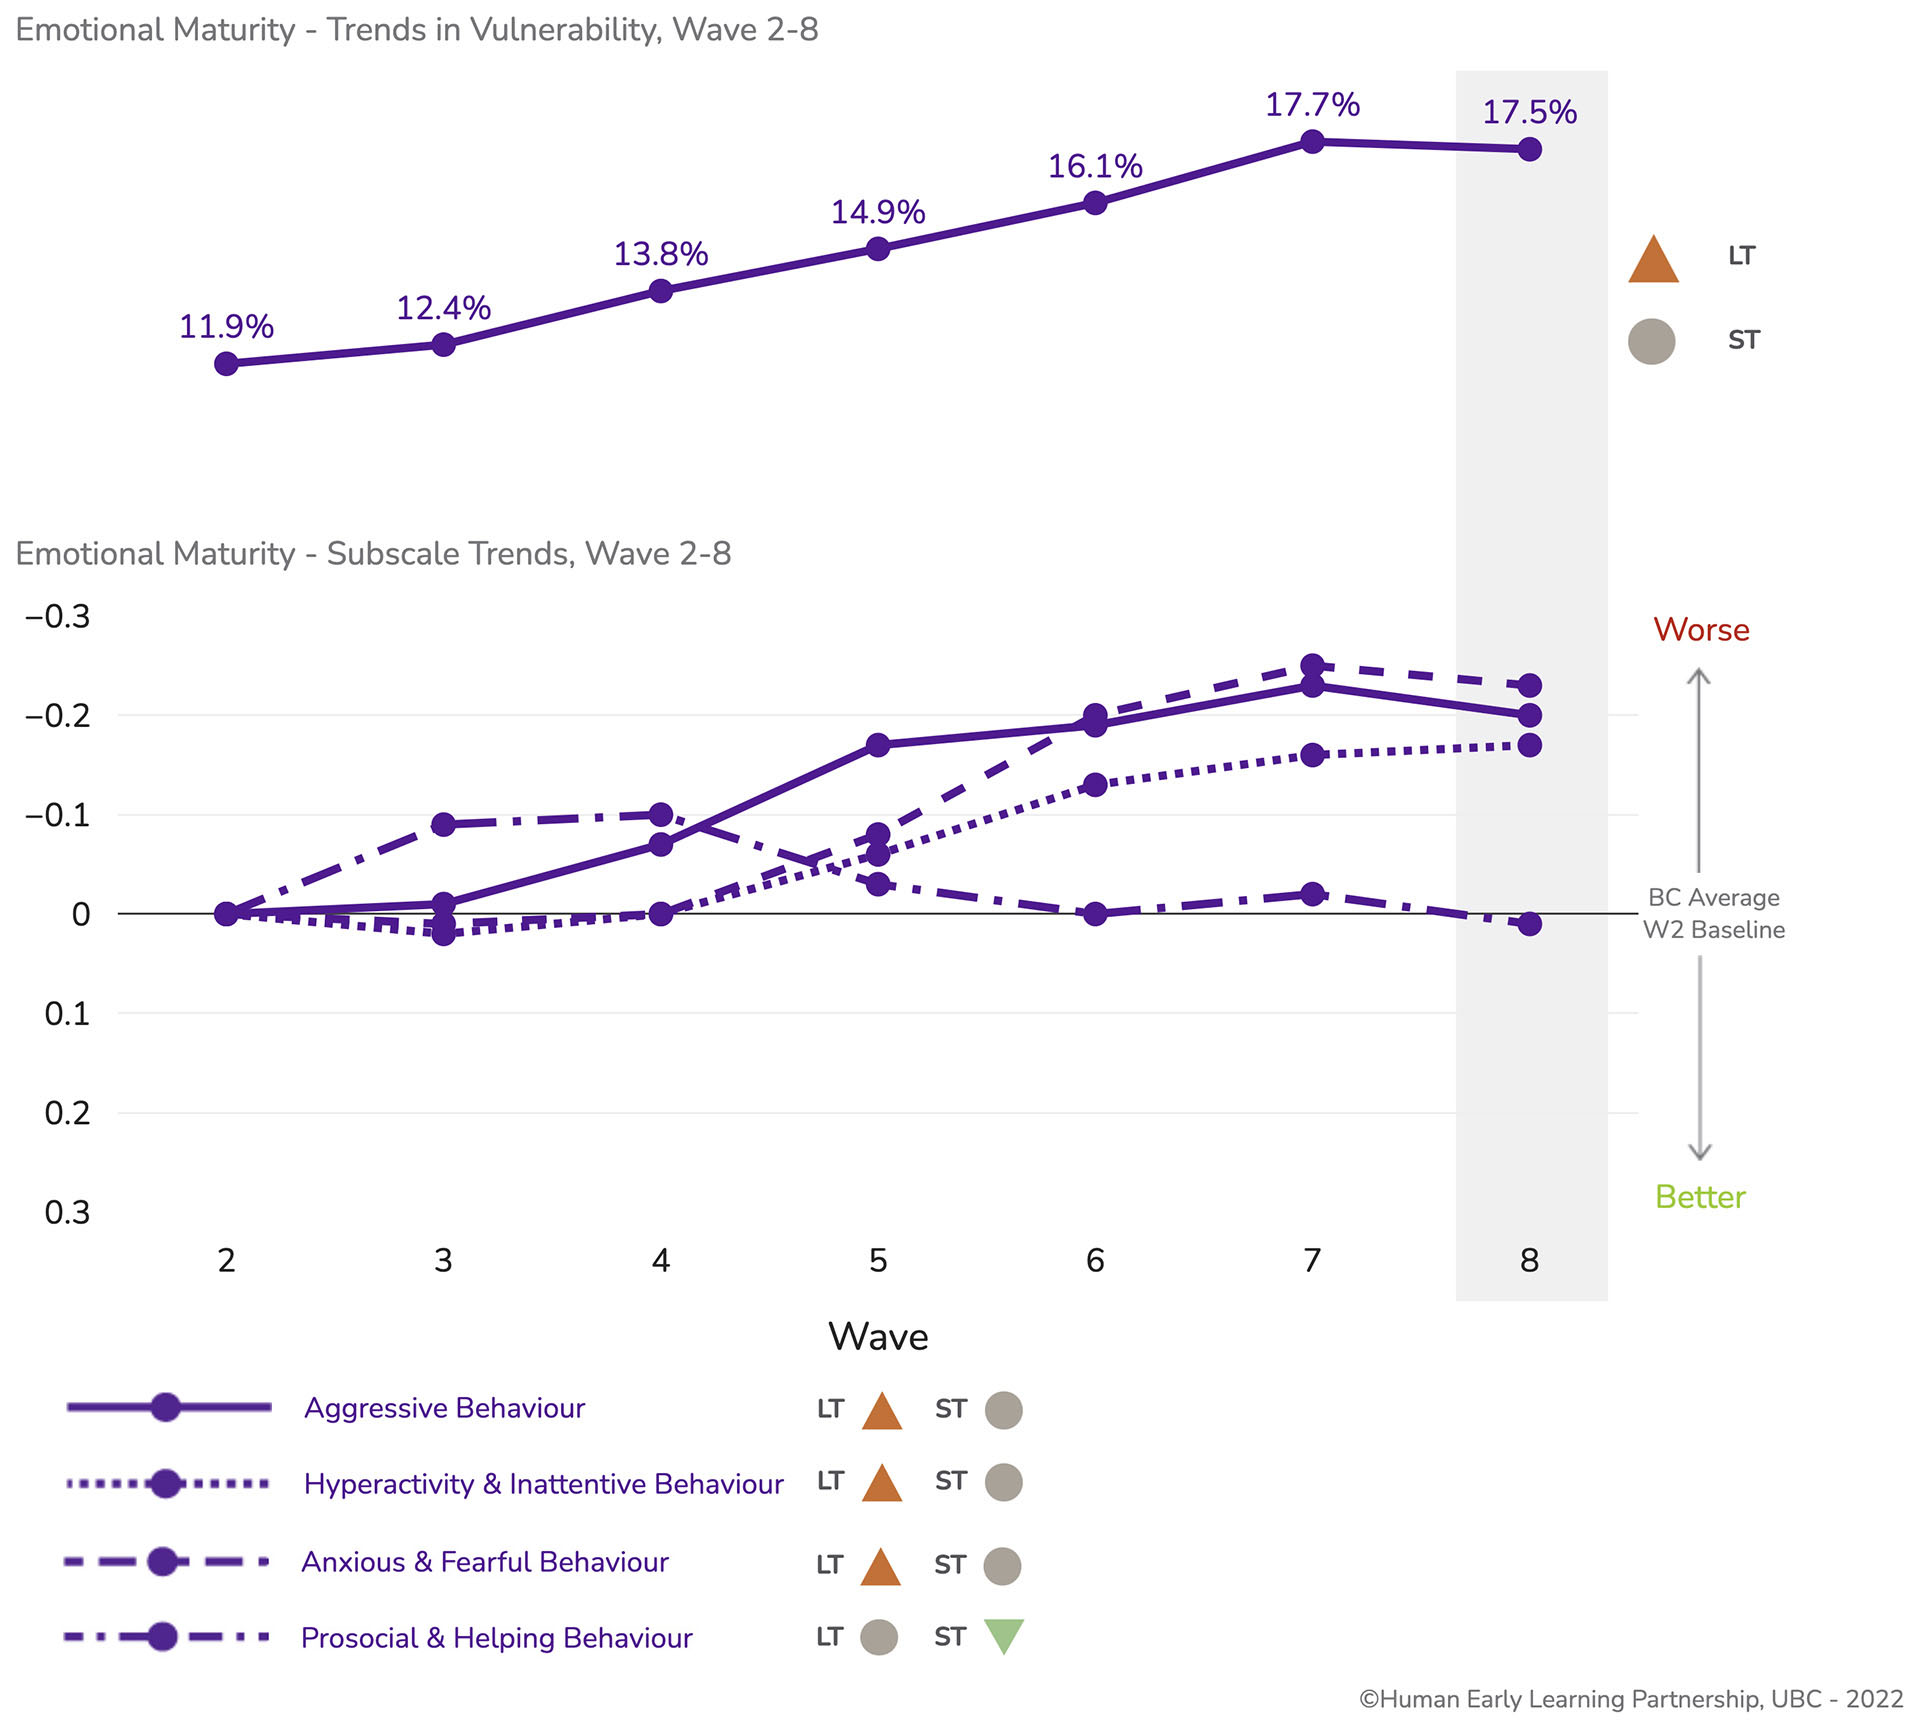
Over the long-term, the Emotional Maturity scale had the largest meaningful increase in vulnerability between Wave 2 (11.9%) and Wave 8 (17.5%). While over the short-term, the trend was stable between Wave 7 (17.7%) to Wave 8 (17.5%). The Emotional Maturity scale has been the scale with the highest vulnerability rate of all five scales for the last three waves.
LT
ST


Aggressive Behaviour

Hyperactivity & Inattentive Behaviour

Anxious & Fearful Behaviour

Prosocial & Helping Behaviour
LT
ST
LT
ST
LT
ST
LT
ST
©Human Early Learning Partnership, UBC - 2022
Emotional Maturity has four subscales. Aggressive Behaviour, Anxious & Fearful Behaviour, and Hyperactive & Inattentive Behaviour have had consistently worsening trends over the long-term, but stable short-term trends. Importantly, the behaviours observed in these three subscales are correlated with the behaviors that represent the most common childhood mental health issues – anxiety disorders, attention deficit and hyperactivity disorder (ADHD), and conduct disorders.5
The Prosocial & Helping Behaviour subscale, on the other hand, has had some variability over time, with a stable long-term trend, but getting better over the short-term between Wave 7 and Wave 8. This is reassuring given recent research that has found positive long-term associations between the prosocial behaviours of kindergarten children and key educational, employment, mental health, and substance use outcomes in young adults.6
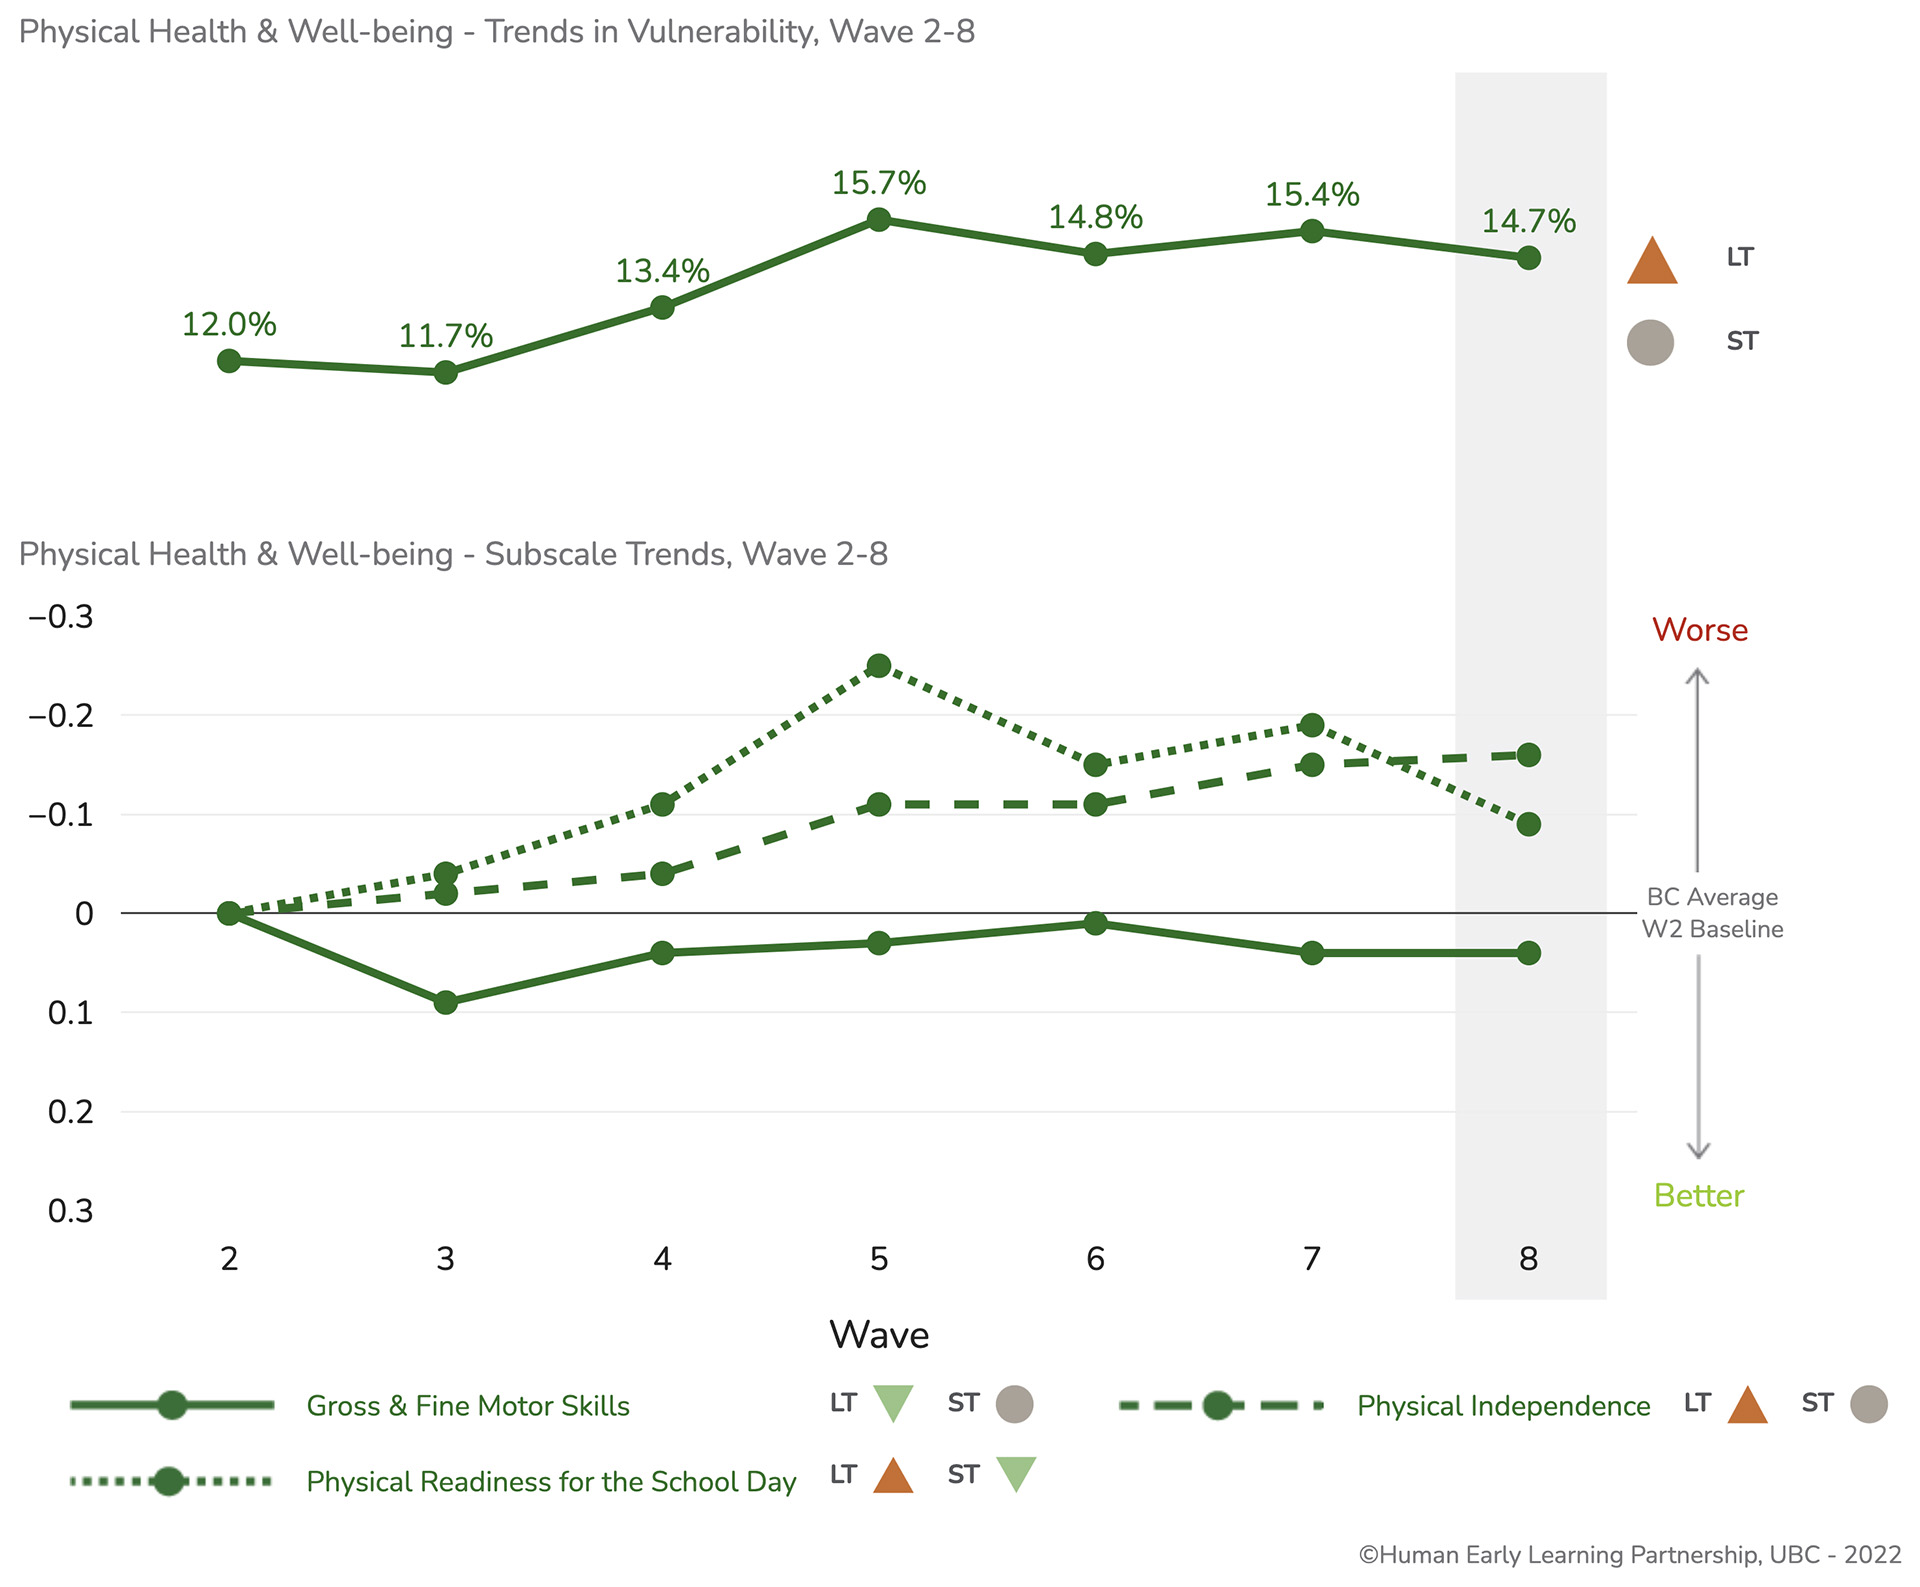
Over the long-term, the Physical Health & Well-being scale had a meaningful increase in vulnerability between Wave 2 (12.0%) and Wave 8 (14.7%). Over the short-term, while not considered a meaningful change, the vulnerability rate for the Physical Health & Well-being scale decreased the most of all five scales down from 15.4% in Wave 7 to 14.7% in Wave 8.
LT
ST

Gross & Fine Motor Skills

Physical Readiness for the School Day
LT
ST
LT
ST

Physical Independence
LT
ST
©Human Early Learning Partnership, UBC - 2022
Physical Health & Well-being has three subscales. The Physical Readiness for the School Day subscale has had some variability over time, with worsening trends over the long term. However, over the short-term, it is the subscale that most closely reflects the trends at the scale-level – it improved between Wave 7 and Wave 8.
While the Physical Independence subscale has had worsening trends over time, the short-term trend is considered stable between Wave 7 and Wave 8. The Gross & Fine Motor Skills subscale improved over the long-term, but was stable between Wave 7 and Wave 8.
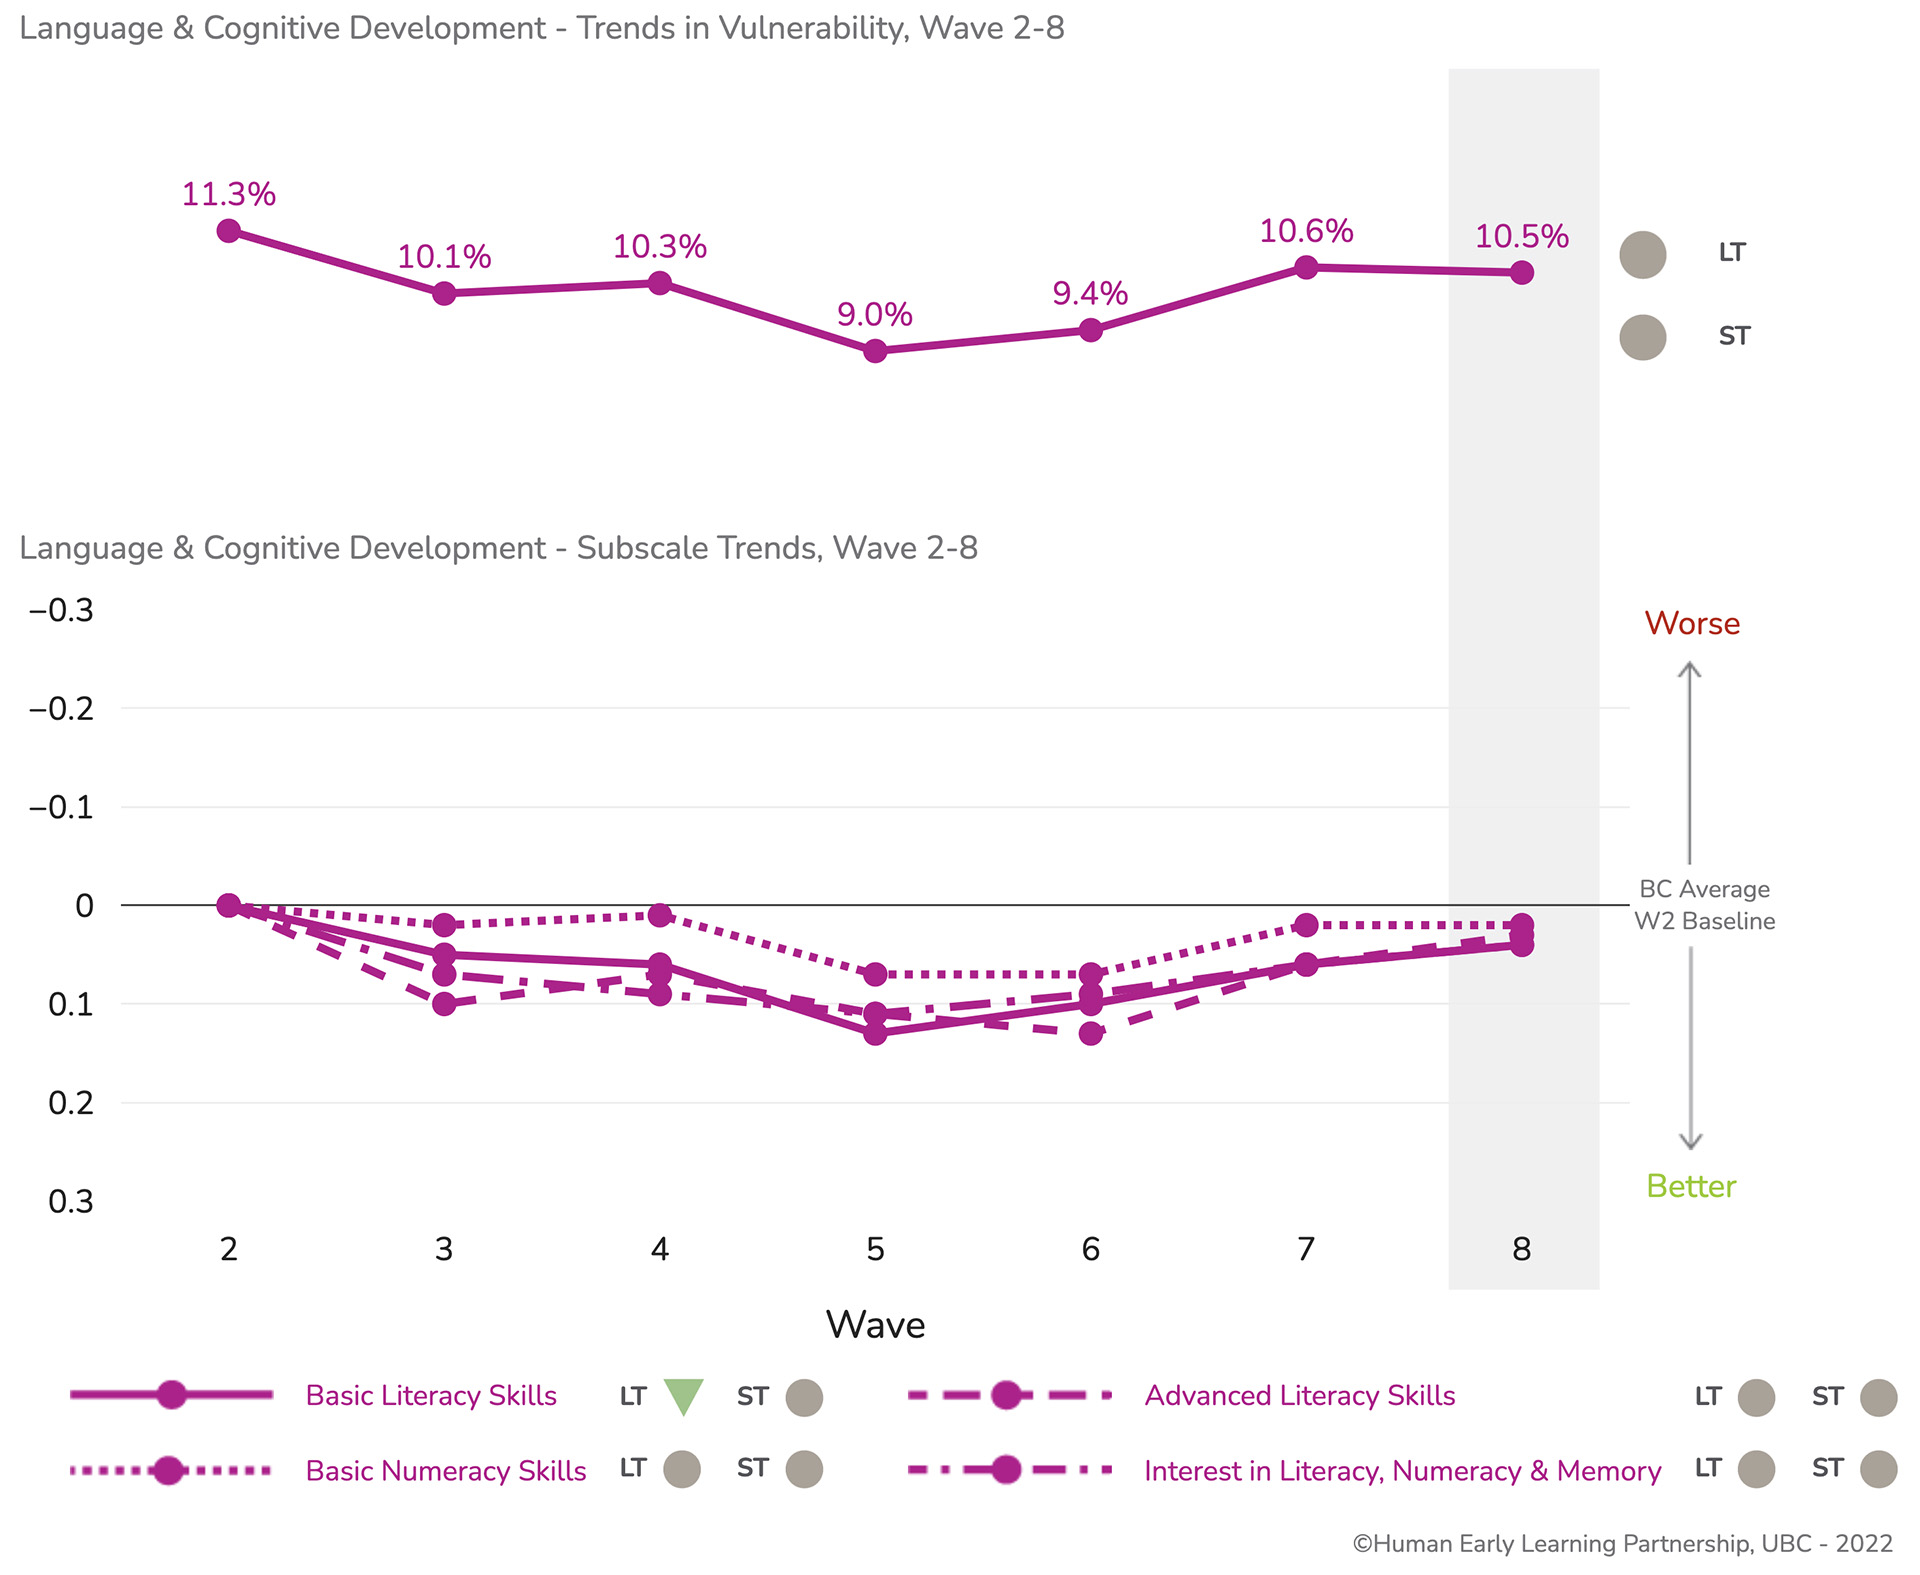
The Language and Cognitive Development scale has had stable trends and the lowest vulnerability rates of all five scales over time. Over the long-term, rates decreased slightly from 11.3% in Wave 2 to 10.5% in Wave 8. Over the short-term, there was little change between Wave 7 (10.6%) and Wave 8 (10.5%).
LT
ST

Basic Literacy Skills

Basic Numeracy Skills
LT
ST
LT
ST

Advanced Literacy Skills

Interest in Literacy, Numeracy & Memory
LT
ST
LT
ST
©Human Early Learning Partnership, UBC - 2022
Language & Cognitive Development has four subscales. Basic Literacy had a long-term improvement, and has remained stable over the short-term. The other three subscales have had stable trends over both the long- and short-terms: Advanced Literacy, Basic Numeracy and Interest in Literacy, Numeracy & Memory.
LT
ST
©Human Early Learning Partnership, UBC - 2022
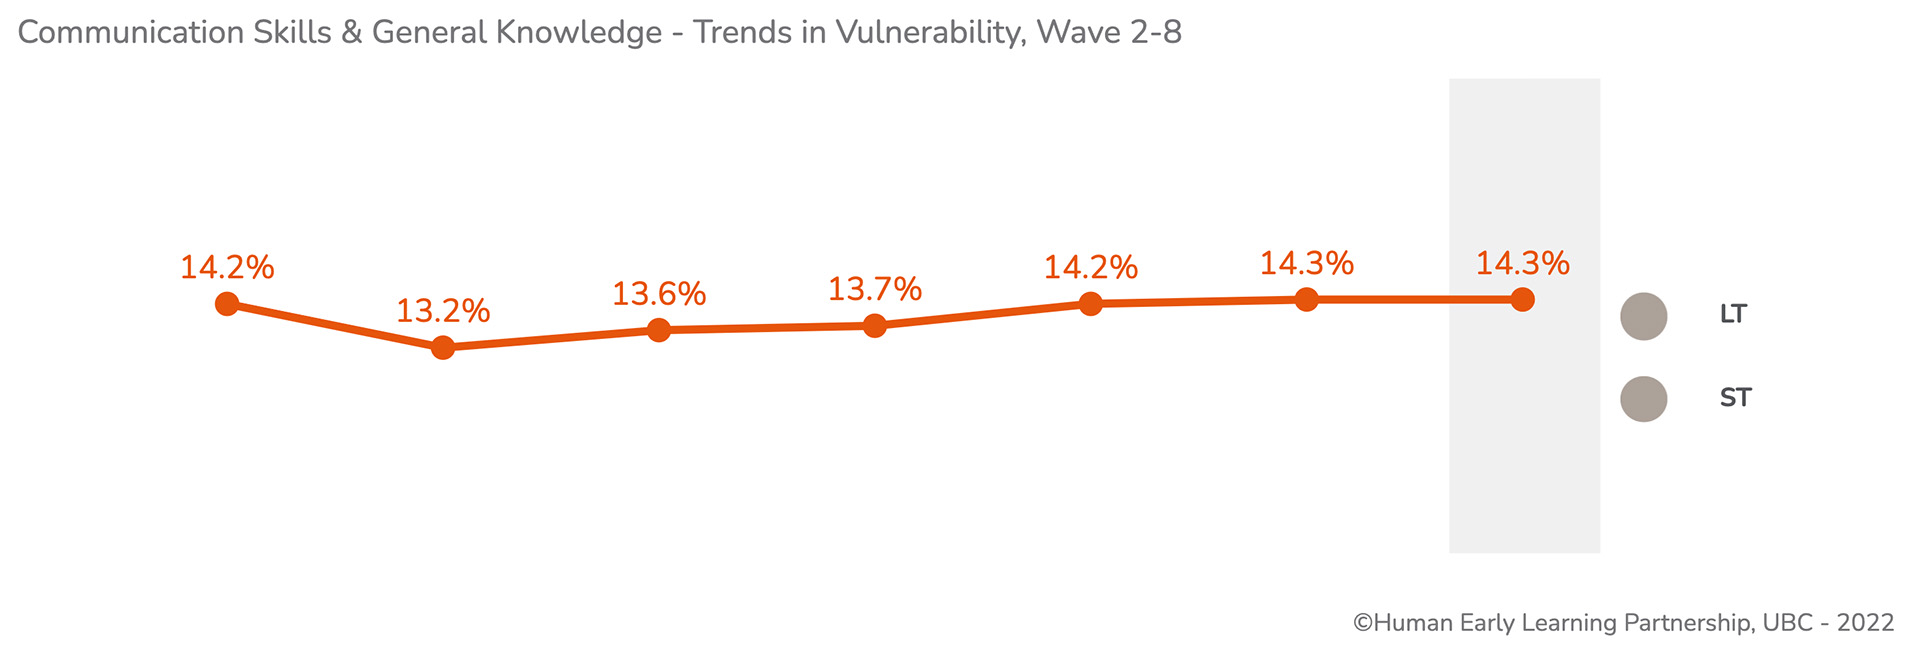
The Communication Skills & General Knowledge scale has had consistent, stable vulnerability trends over both the long- and short-terms – changing little from the Wave 2 rate of 14.2% to 14.3% in Wave 8, and no change over the short-term (14.3% for both Waves 7 and 8). The Communication Skills & General Knowledge scale has no subscales, but includes items related to ability to communicate in English (the language of classroom instruction), being understood by others, and being able to understand what others are communicating.
HELP data show a link between vulnerability on the Communication Skills & General Knowledge scale and the proportion of a population who are newcomers to Canada and are English language learners (ELL designation). Evidence also suggests that this vulnerability resolves itself for many children as they progress through the school system and develop competence in the language of instruction.
The stable trend in EDI vulnerability rates between Wave 7 (2016-2019) and Wave 8 (2019-2022) is perhaps surprising given the immense disruption caused by the COVID-19 pandemic. Data collected through the other Child Development Monitoring System tools(CHEQ, MDI, YDI) during this same period broaden the story about the impact of the pandemic on the experiences, health and well-being of children, youth and adults in BC. It is also important to consider that many of the youngest infants and toddlers born and developing during the pandemic have not yet entered the school system, and data on their developmental outcomes will only be available in future EDI waves.
It is possible that new federal and provincial policies to support children and families introduced or expanded since Wave 7 have influenced children’s vulnerability rates during this challenging time. At the provincial level, these policies included the BC government’s passing of the Declaration on the Rights of Indigenous Peoples Act7, the move toward universal, affordable childcare8 and the first provincial poverty reduction strategy9. At the federal level, there were increases to the Canada Child Benefit10, extensions to parental leave11, and a commitment to, and investment in, a national early learning and child care strategy.12
While the pandemic presented a major disruption, federal and provincial pandemic relief programs provided income support for two-thirds of all Canadian adults, three-quarters of the adults in BC (the highest in country)13. According to newly released census data, the Canadian low-income rate decreased in 2020, especially for families with children, largely driven by government transfers14. And, between 2015-2022, income inequality decreased in all provinces and territories.
Previous EDI research has demonstrated a strong association between EDI overall vulnerability and the socioeconomic status of neighbourhoods and families15,16. More research is in progress that explores the relationships between these large-scale policies and investments as well as global events on the health and well-being of children, families and communities.
The ongoing prevalence of childhood vulnerability – still 1 in 3 – is a continuing concern and responsibility for all sectors. At the community and neighbourhood levels, there is considerable variability in Wave 8 vulnerability rates and trends over time. The opportunity to explore EDI data at the community, neighbourhood and other regional aggregations will be available soon through a new interactive data dashboard.
Overall, there is more to unpack. With Wave 8 marking 20 years of EDI data collection, and a Child Development Monitoring System growing more robust with each year, there is now significant BC-specific child development and well-being data available for analysis and research purposes. This is an important time for HELP and our partners in research, government, education, and health to explore the relationships between the Monitoring System datasets and their linkages with other health, education and administrative datasets to learn more about this developing story.
Stay tuned! More to come from the Child Development Monitoring System
Be sure to subscribe to our newsletter and follow us on Facebook and Twitter, to stay up to date on future events and announcements including:

Watch the webinar recording of the 20 Years of EDI Data: Wave 8 BC Summary webinar with commentary on the trends and a glimpse into analysis already underway with EDI data. Watch now.

Highlights from the substantial body of research using the EDI. Learn more about the breadth of EDI research through this recently released narrative review.
Childhood Experiences Questionnaire (CHEQ) 2022 data & trends over time. The CHEQ is a questionnaire completed by parents and caregivers at the start of their child’s kindergarten year about their early experiences and environments prior to starting school. Webinar and project-level reports to come in 2023!

Exploring the relationship between EDI vulnerability and socioeconomic status. As Statistics Canada releases the Census 2021 data, HELP will be exploring this relationship, including differences over time and across geographies.
References
- Irwin LG, Siddiqi A, Hertzman C. Early child development: a powerful equalizer. Final report for the World Health Organization’s Commission on the Social Determinants of Health. Vancouver, BC: University of British Columbia, Human Early Learning Partnership; 2007 Jun. Available from: https://earlylearning.ubc.ca/app/uploads/2022/06/who_ecd_final_report.pdf.
- National Scientific Council on the Developing Child. Connecting the brain to the rest of the body: early childhood development and lifelong health are deeply intertwined. Working paper No. 15;. 2020. Cambridge, MA: National Scientific Council on the Developing Child. Available from https://harvardcenter.wpenginepowered.com/wp-content/uploads/2020/06/wp15_health_FINALv2.pdf.
- Children First Canada. Raising Canada 2022 - Top 10 Threats to Childhood in Canada. Ottawa, ON: Children First Canada; 2022. Available from: https://childrenfirstcanada.org/wp-content/uploads/2022/09/RC2022_CFC_RC-Report_09-02.pdf.
- Public Health Agency of Canada. Report from the Canadian Chronic Disease Surveillance System: mental illness in Canada. Ottawa, ON: PHAC; 2015. Available from: https://www.canada.ca/en/public-health/services/publications/diseases-conditions/report-canadian-chronic-disease-surveillance-system-mental-illness-canada-2015.html.
- Canadian Mental Health Association - British Columbia Division. Mental illness in children and youth. Vancouver, BC: CMHA; 2019. Available from: https://cmha.bc.ca/documents/mental-illnesses-in-children-and-youth-2/.
- Jones DE, Greenberg M, Crowley M. Early social-emotional functioning and public health: the relationship between kindergarten social competence and future wellness. Am J Public Health. 2015:e1-e8. Available from: http://dx.doi.org/10.2105/AJPH.2015.302630.
- Government of British Columbia. Declaration on the Rights of Indigenous Peoples Act. Victoria, BC: Government of British Columbia; 2019. Available from: https://www2.gov.bc.ca/gov/content/governments/indigenous-people/new-relationship/united-nations-declaration-on-the-rights-of-indigenous-peoples.
- Government of British Columbia. Child care B.C. Caring for kids, lifting up families: the path to universal child care. Victoria, BC: Government of British Columbia; 2018 Feb. Available from: https://www2.gov.bc.ca/gov/content/family-social-supports/caring-for-young-children/child-care-strategy.
- Government of British Columbia. TogetherBC. British Columbia’s poverty reduction strategy. Victoria, BC: Government of British Columbia; 2019. Available from: https://www2.gov.bc.ca/gov/content/governments/about-the-bc-government/poverty-reduction-strategy.
- Revenue Canada. Child care benefit. Ottawa, ON: Government of Canada. [2018; cited 2022 Nov 2]. Available from: https://www.canada.ca/en/revenue-agency/programs/about-canada-revenue-agency-cra/federal-government-budgets/budget-2016-growing-middle-class/canada-child-benefit.html.
- Employment and Social Development Canada. More choice for parents. Ottawa, ON: Government of Canada. [2019; cited 2022 Nov 2]. Available from: https://www.canada.ca/en/employment-social-development/campaigns/ei-improvements/parental-choice.html.
- Employment and Social Development Canada. Towards $10-a-day: Early learning and child care. Ottawa, ON: Government of Canada. [2022; cited 2022 Nov 2]. Available from: https://www.canada.ca/en/employment-social-development/campaigns/child-care.html?utm_campaign=not-applicable&utm_medium=vanity-url&utm_source=canada-ca_Canada.ca/child-care.
- Statistics Canada. The contributions of pandemic relief benefits to the incomes of Canadians in 2020. Ottawa, ON: Statistics Canada [2022; cited 2022 Nov 2]. Available from: https://www12.statcan.gc.ca/census-recensement/2021/as-sa/98-200-X/2021005/98-200-X2021005-eng.cfm.
- Statistics Canada. Income profile of Canadians. Ottawa, ON: Statistics Canada [2022; cited 2022 Nov 2]. Available from: https://www.statcan.gc.ca/en/sc/video/income-profile-canadians.
- Human Early Learning Partnership. Wave 7 Early Development Instrument (EDI) Provincial Report. Vancouver, BC: University of British Columbia, Faculty of Medicine, School of Population and Public Health; 2019 Nov. Available from: http://earlylearning.ubc.ca/media/edibc_wave7_2019_provincialreport.pdf.
- Janus M, Reid-Westoby C, Raiter N, Forer B, Guhn M. Population-level data on child development at school entry reflecting social determinants of health: a narrative review of studies using the early development instrument. Int J Environ Res Public Health. 2021;18(7):3397. Available from: https://www.mdpi.com/1660-4601/18/7/3397.
Over the long-term, the Social Competence scale had a meaningful increase in vulnerability between Wave 2 (13.3%) and Wave 8 (16.3%). Over the short-term, the trend was stable between Wave 7 (16.1%) to Wave 8 (16.3%).
LT
ST
Overall Social Competence
Readiness to Explore New Things
LT
ST
LT
ST
Approaches to Learning
Respect & Responsibility
LT
ST
LT
ST
©Human Early Learning Partnership, UBC - 2022
Social Competence has four subscales: Overall Social Competence, Approaches to Learning, and Respect & Responsibility had worsening trends over the long-term, but stable short-term trends. The Readiness to Explore New Things subscale had stable trends both over the long- and short-term.