Middle childhood, or the “middle years,” is a pivotal period of human development. Experiences in this period can have long-lasting effects. Between the ages of 9 to 13, children experience important cognitive, biological, social, and emotional changes that contribute to their lifelong identity and lay the foundation for successful development in adolescence and adulthood.
To promote healthy development and well-being in middle childhood and beyond, the Human Early Learning Partnership (HELP, UBC) collects data through the Middle Years Development Instrument (MDI) and other Child Development Monitoring System tools. This work, done in partnership with BC school districts, aims to “shine the light” on how children are doing and inspire action.
Implemented in BC since 2009, over three-quarters of BC school districts have participated in MDI data collection over the years. This is the first online MDI report of this kind – a synthesis of MDI data collected across all participating BC school districts from the 2023/24 school year and over time. New to the MDI? Learn the basics on our MDI Overview page.
Key Findings
Declining Thriving
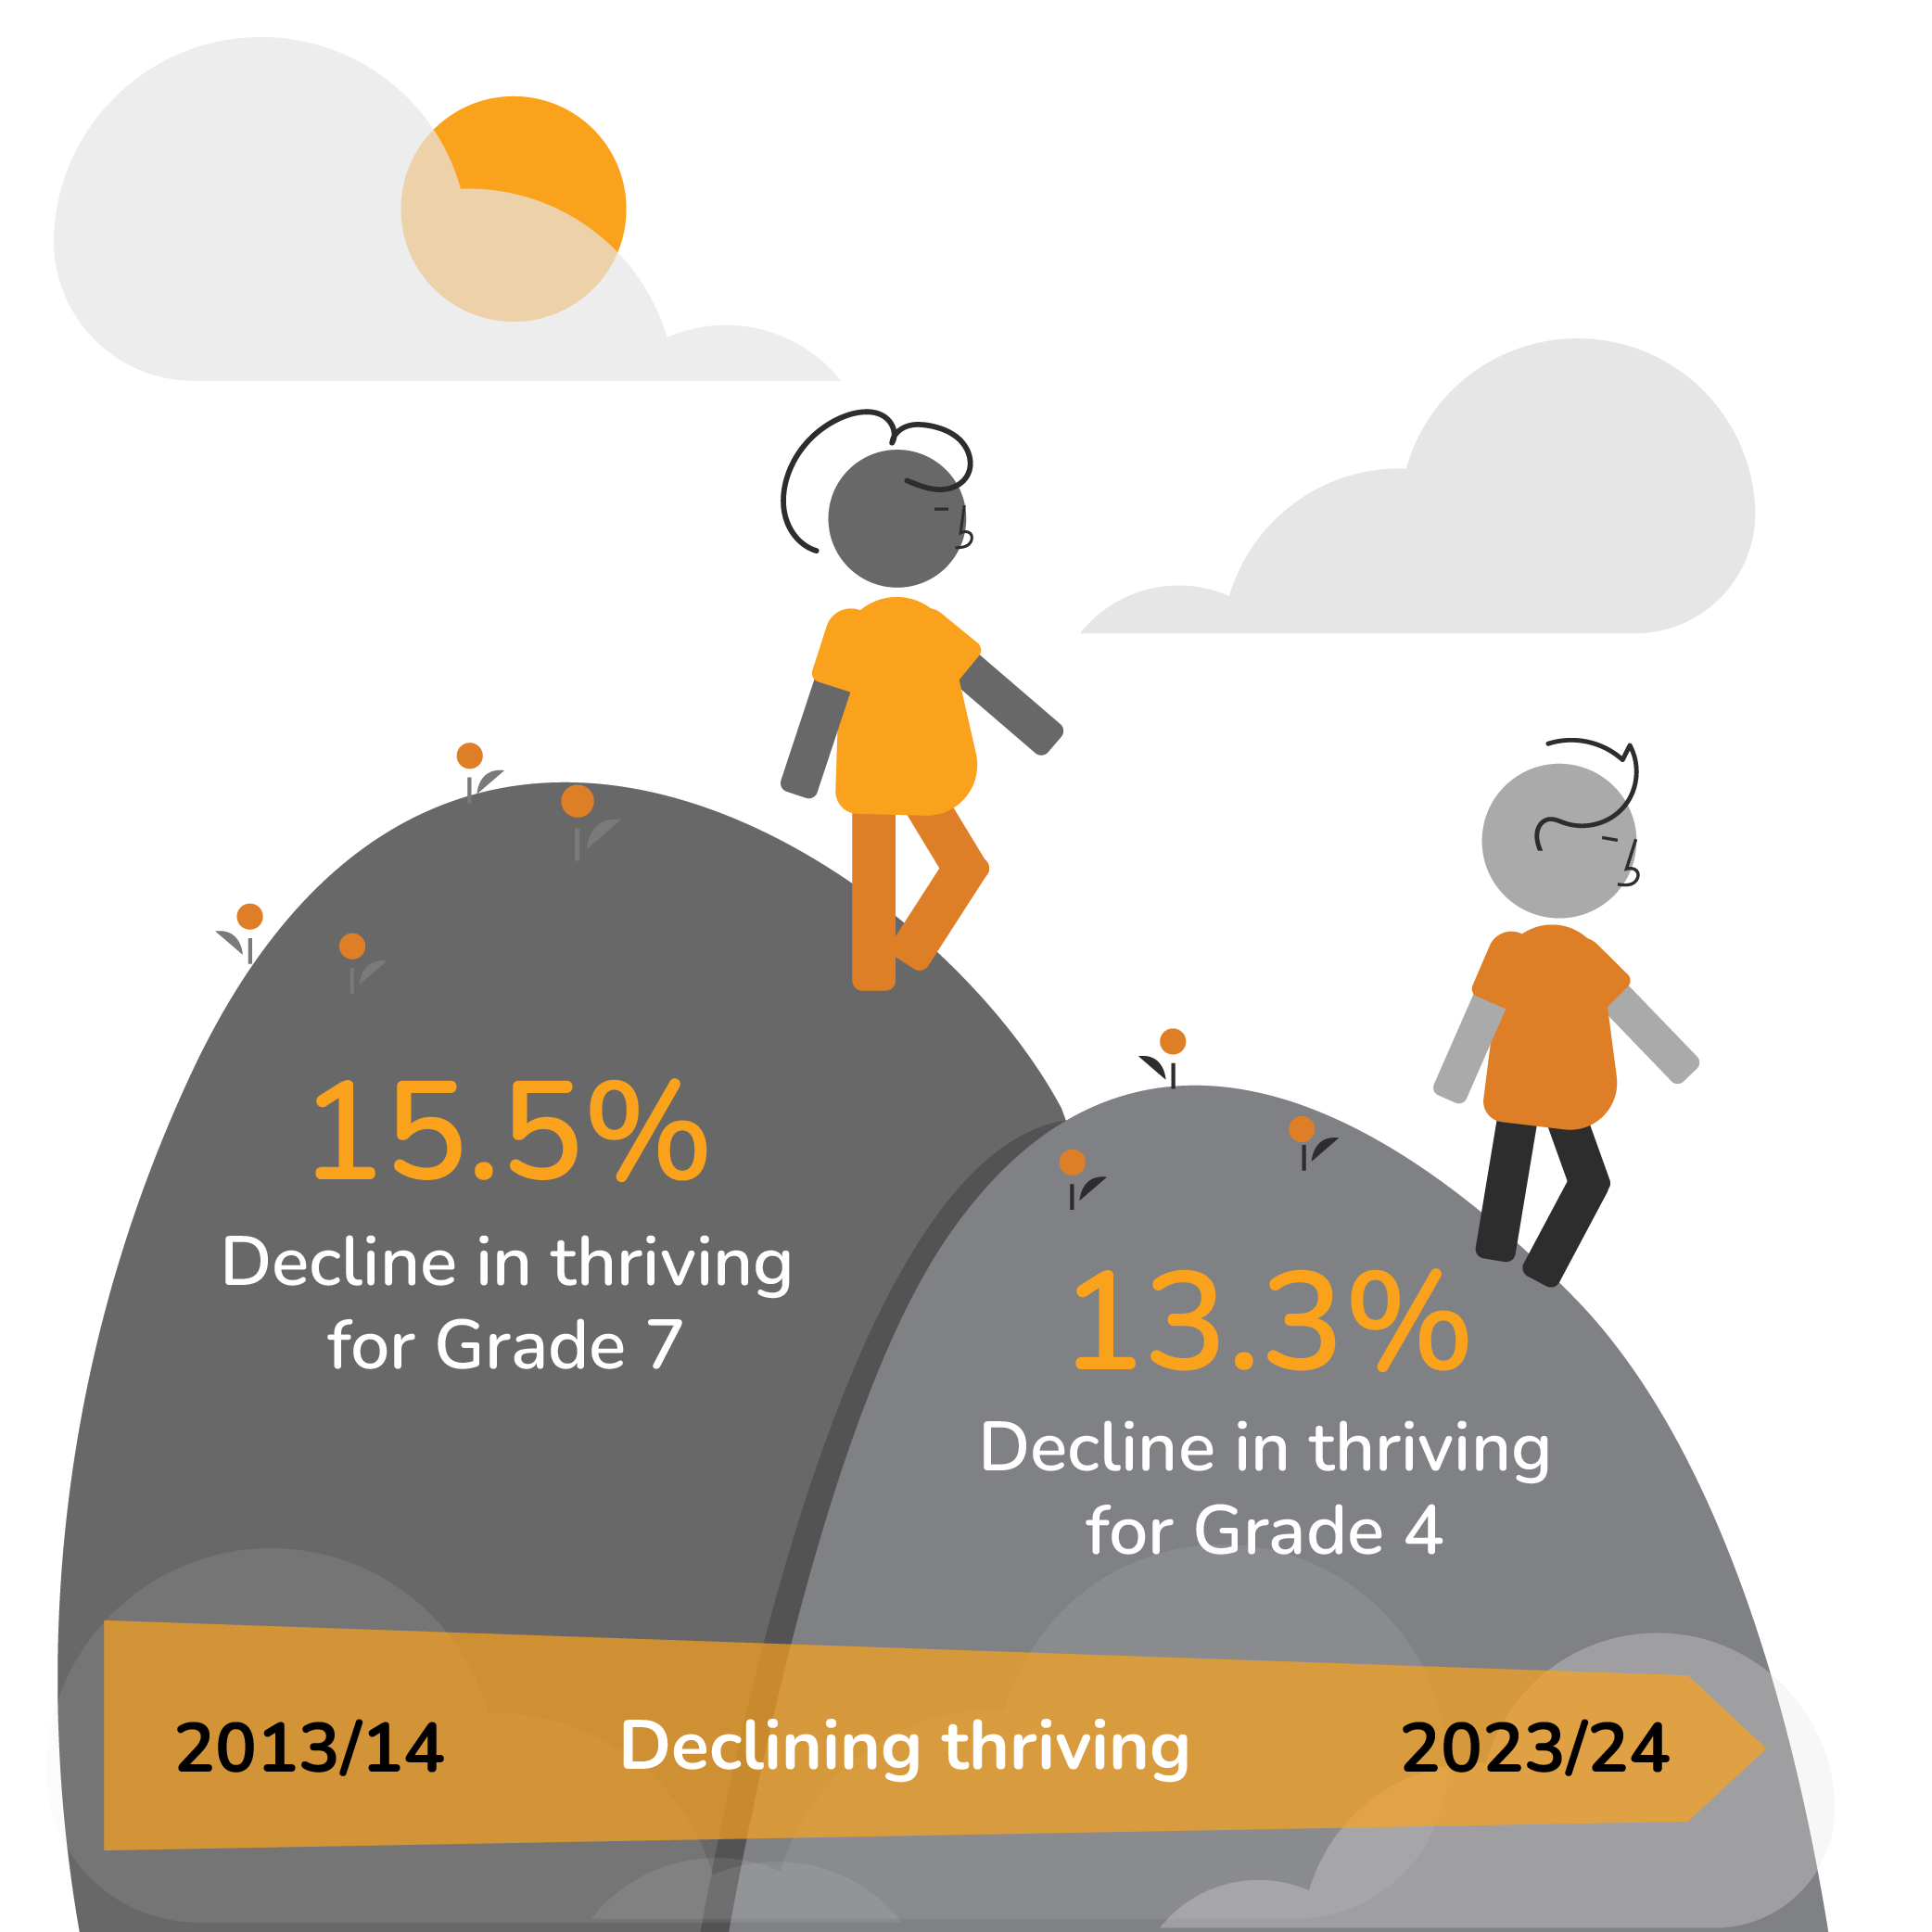
Over the last decade, children’s reported rates of thriving (high well-being) on the MDI have been declining. Especially evident during the COVID-19 pandemic, this pattern is consistent with national and international research on trends in well-being in the middle years and adolescence. 1-6 However, MDI data suggest that this trend is beginning to shift with children more recently reporting rates of thriving similar to before the pandemic.
Context Matters
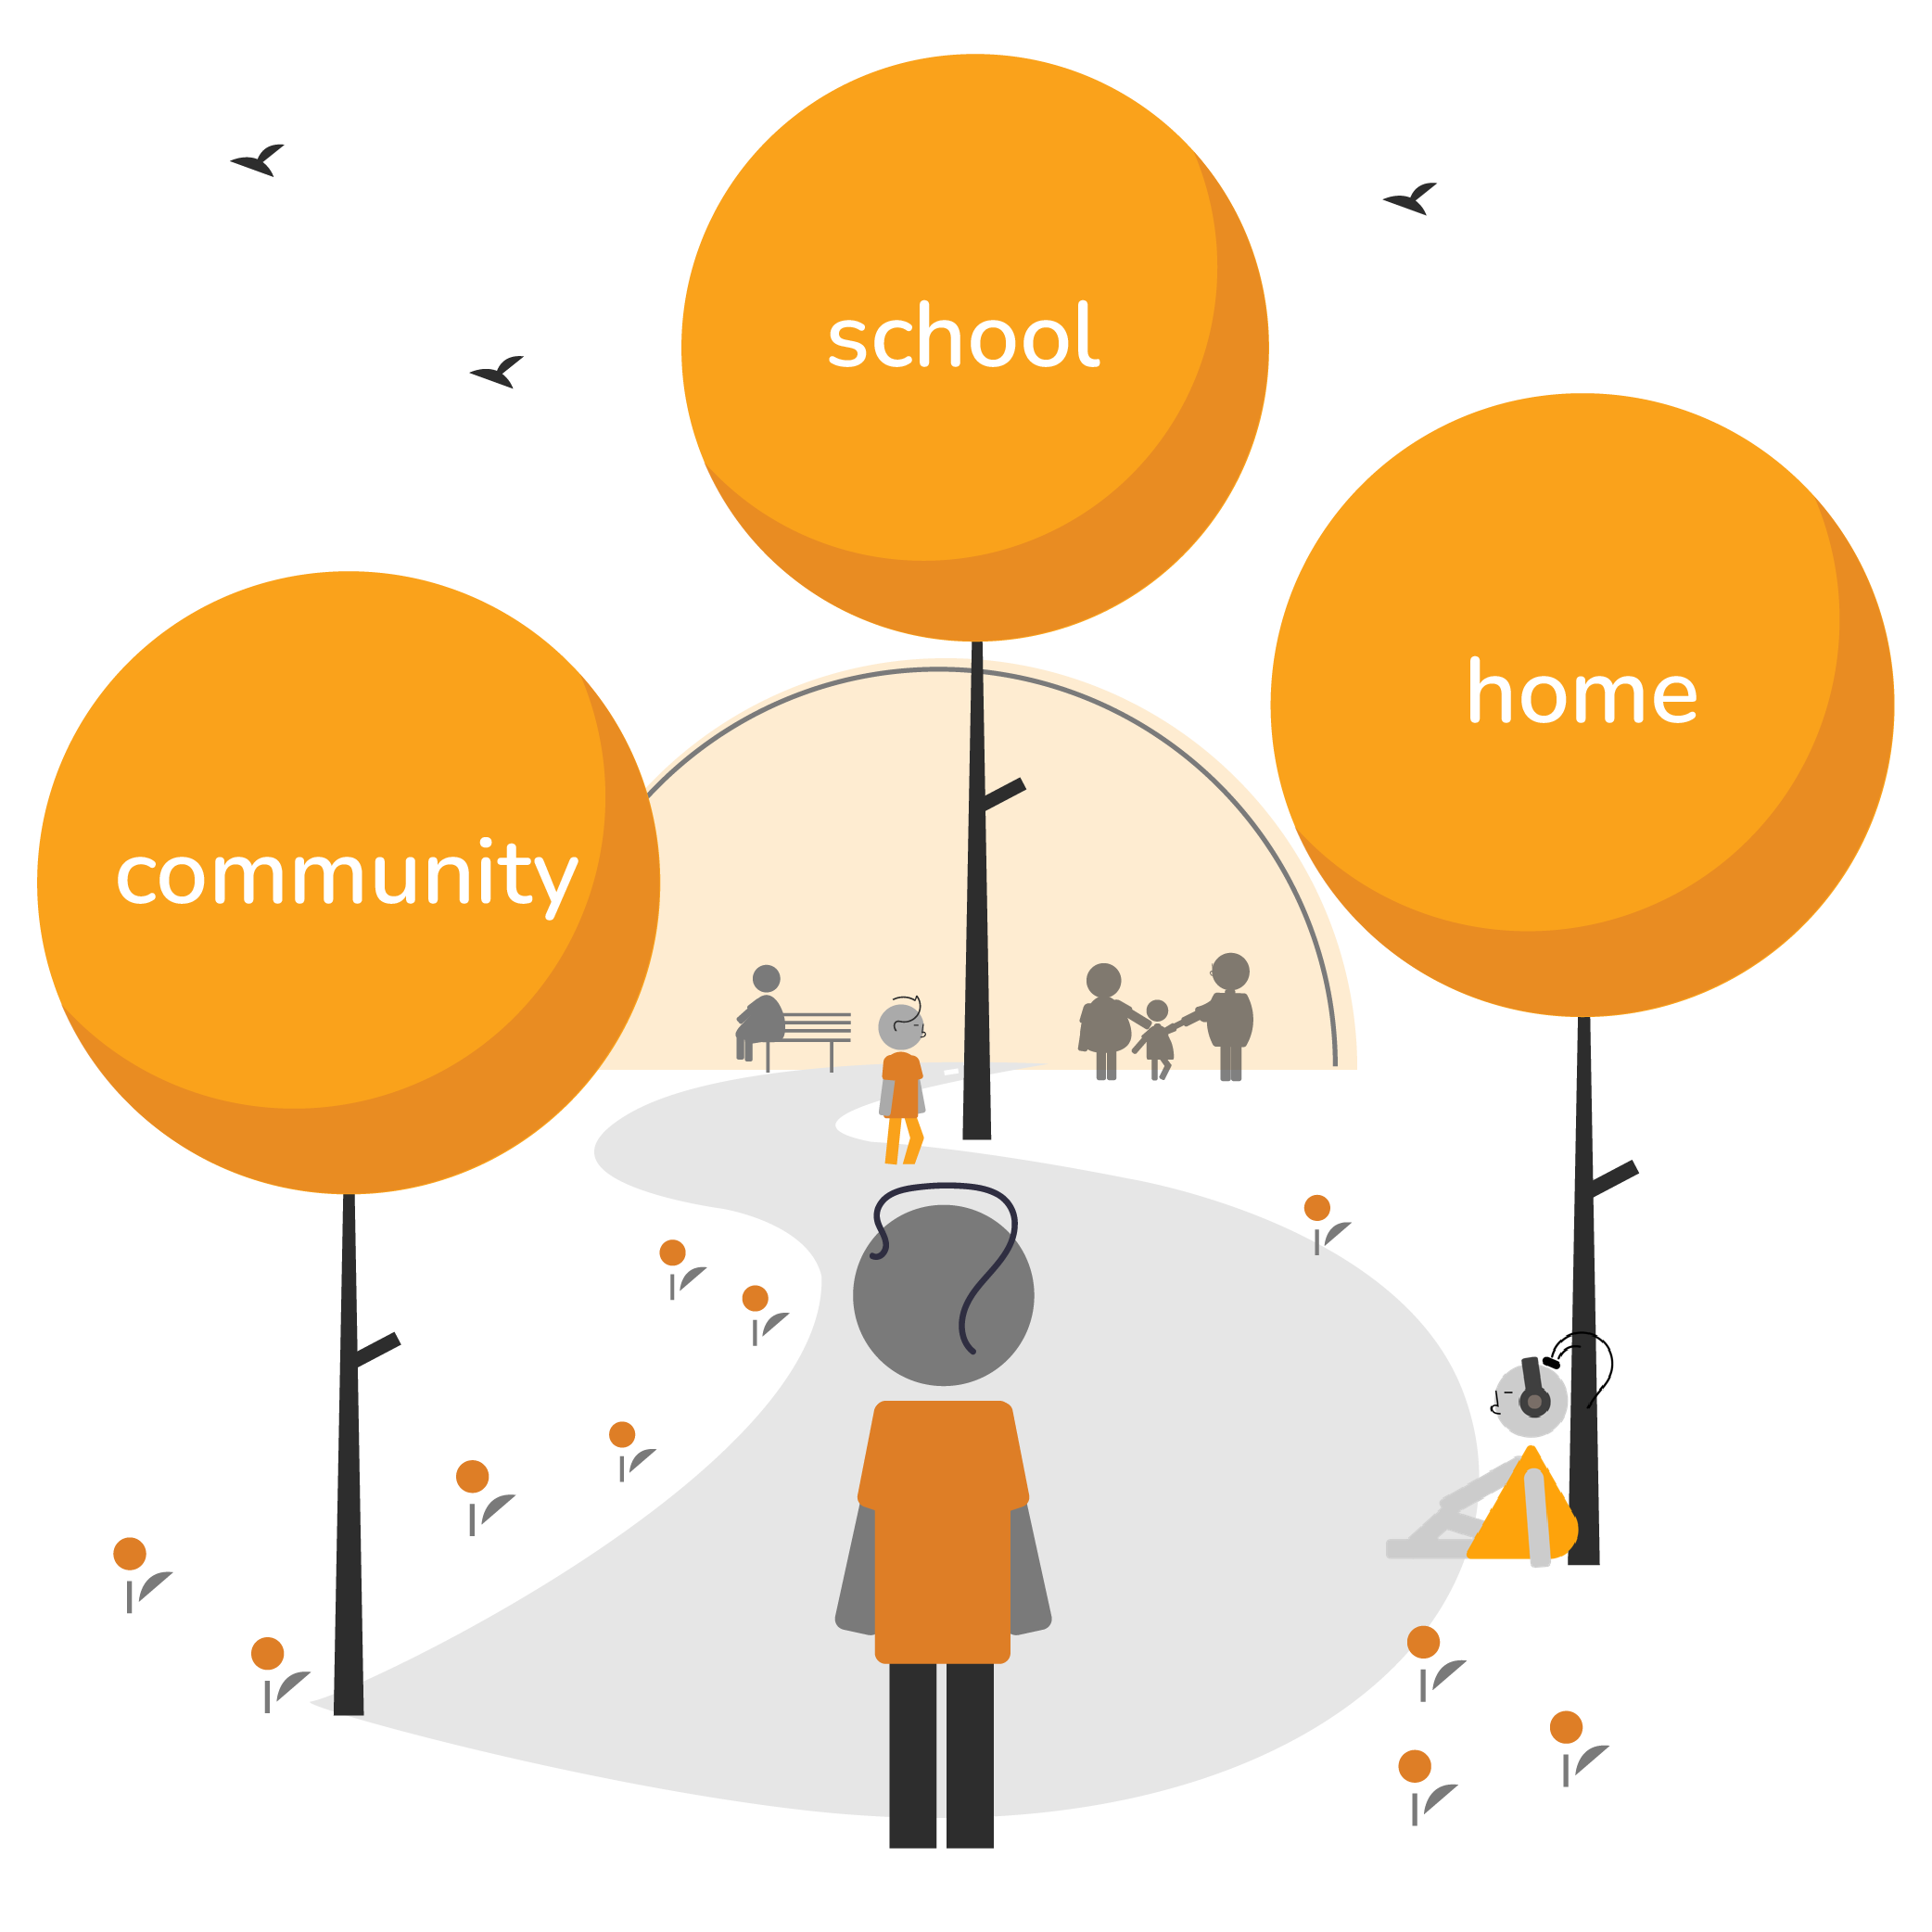
The context in which children live, grow, play and learn affects their development and well-being. MDI data demonstrate considerable variation in rates of thriving and assets across school districts and at the neighbourhood level. This suggests that children’s home, school, and community contexts influence their overall health, happiness, and well-being.
Relationships Matter
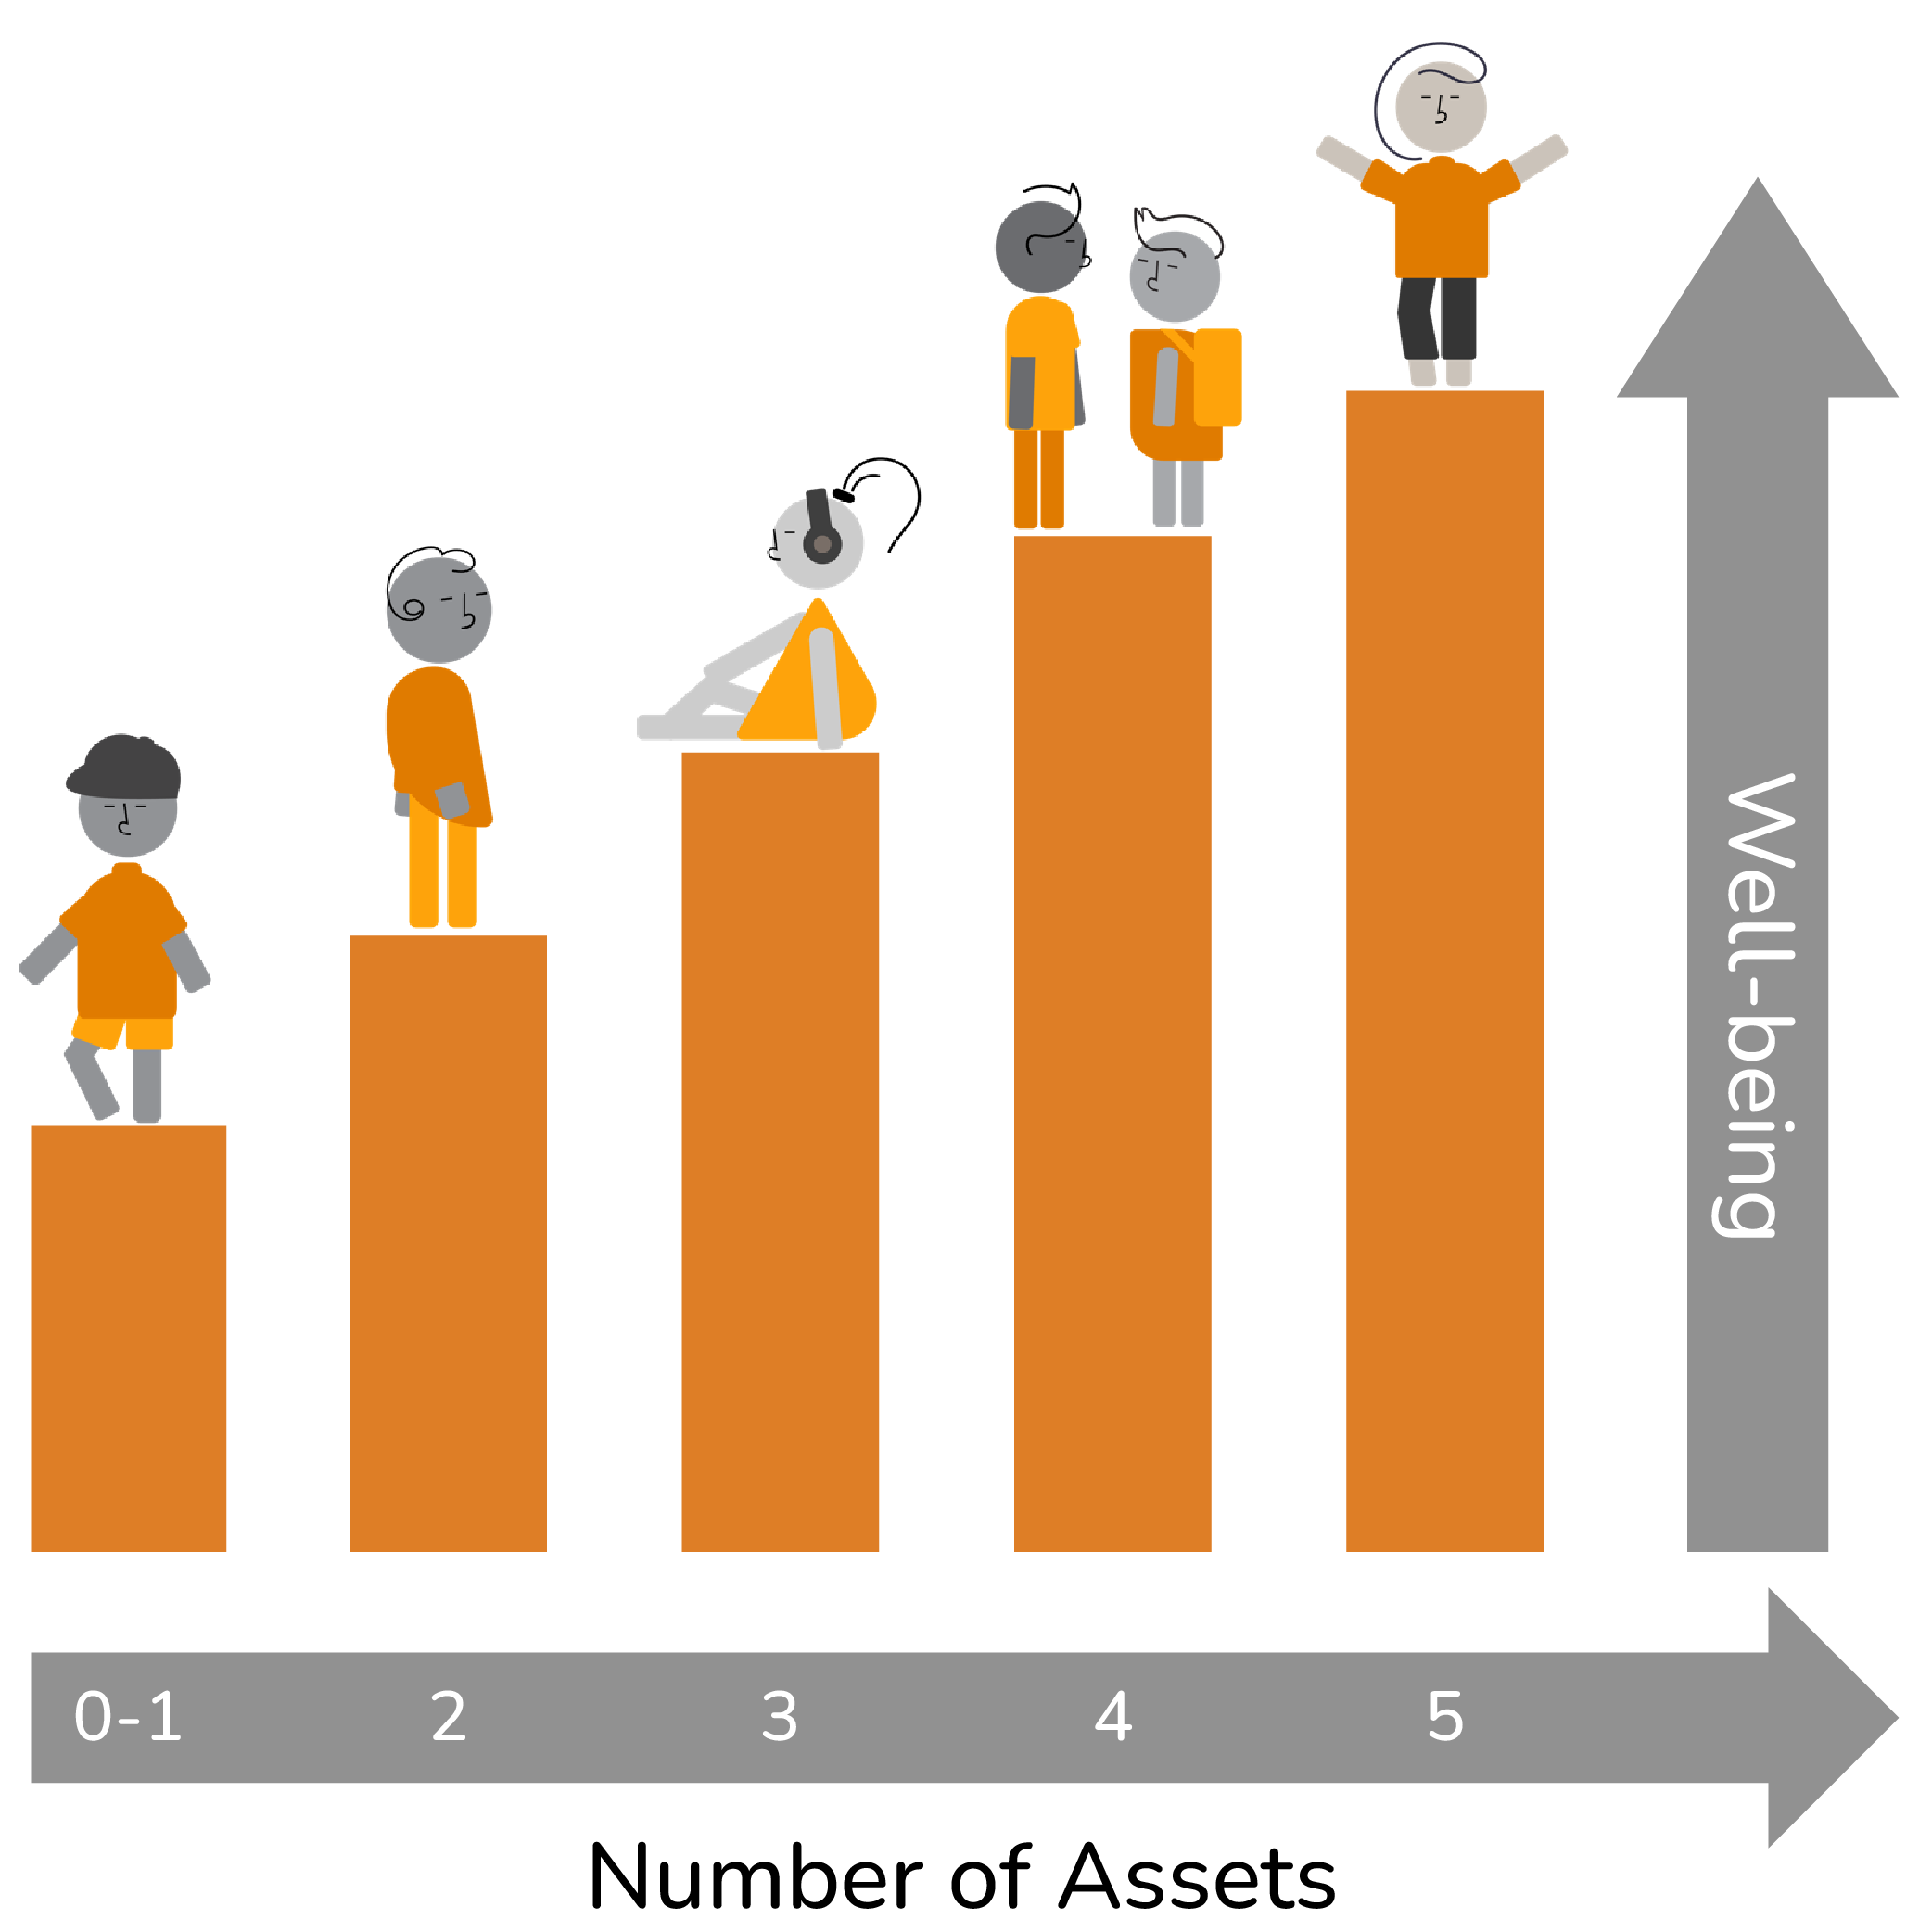
Being connected to peers and adults at school, and adults at home and in the community are key protective factors for children’s well-being. 7-8 MDI data have consistently shown a strong relationship between these assets in children’s lives and their reported well-being, with children who have more assets being more likely to report thriving.
Healthy Habits Help
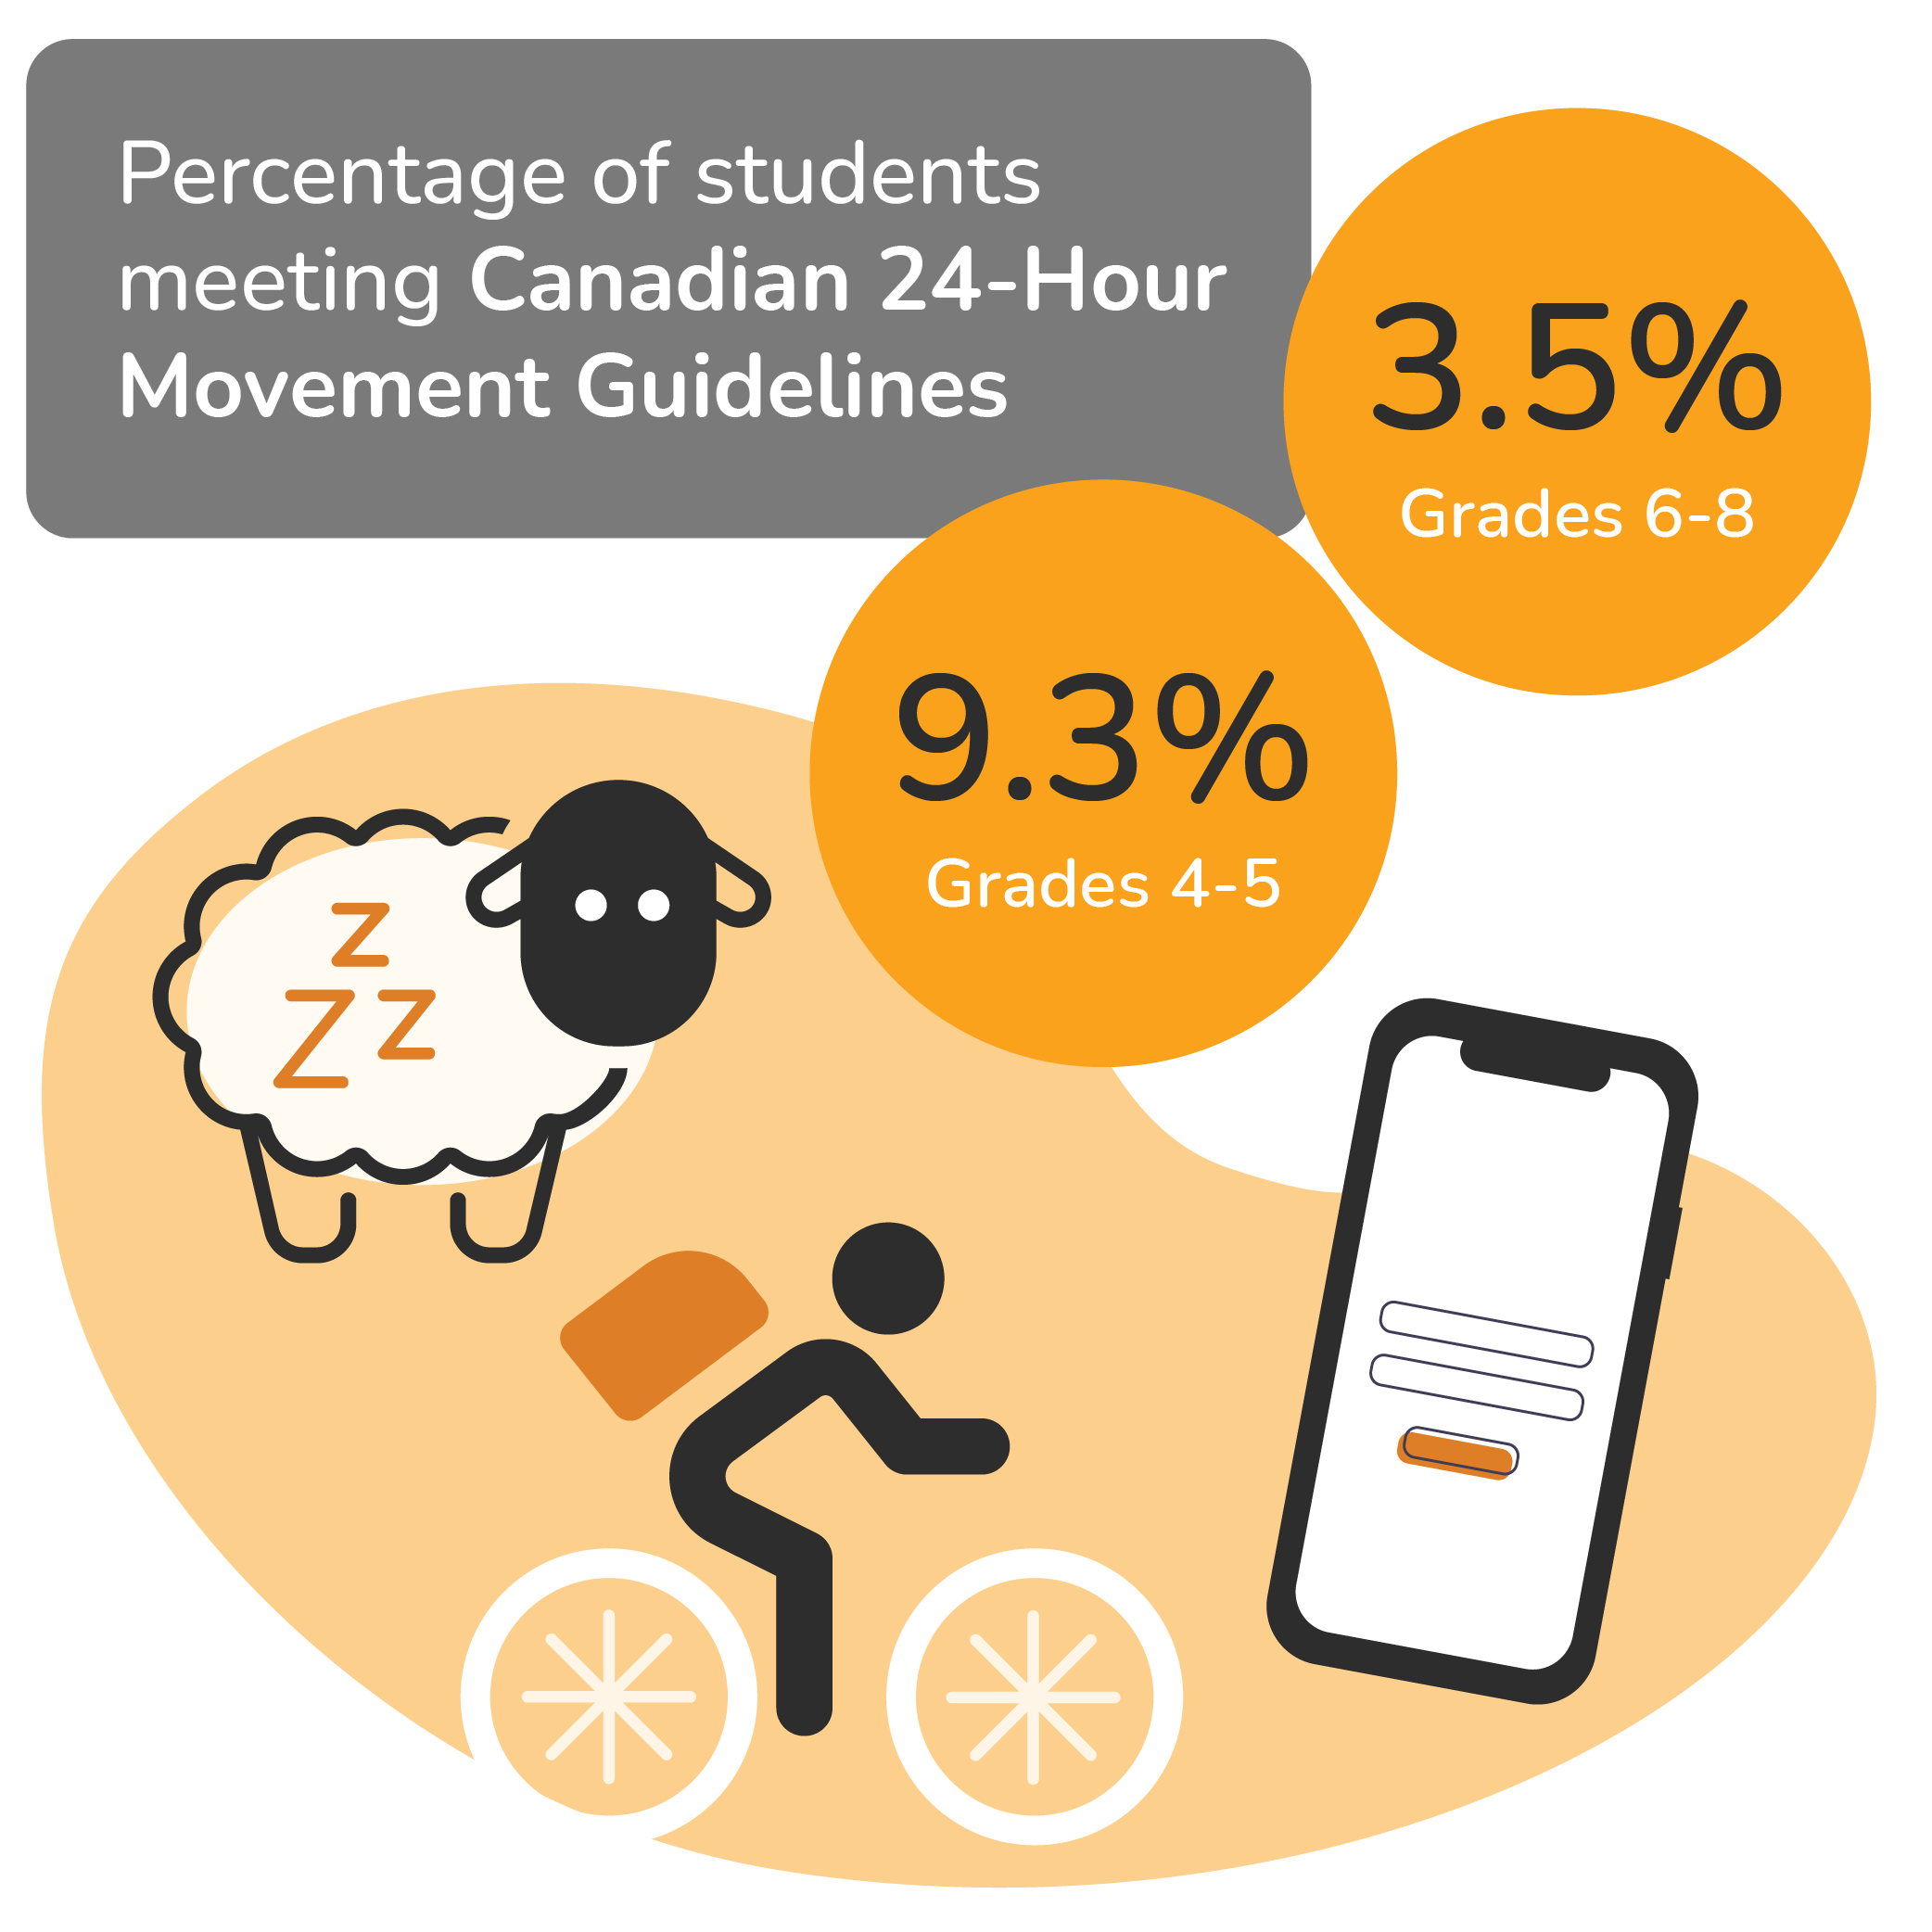
Children who meet Canada’s 24-Hour Movement Guidelines are more likely to be healthy and experience well-being overall. 9-11 Recent MDI results show that only 9.3% of children in Grades 4-5 and 3.5% of children in Grades 6-8 are meeting all these recommendations. Children who reported meeting all three recommendations are up to 4 times more likely to report thriving compared to those who reported meeting none of the recommendations.
MDI Participation
The MDI was first piloted in the 2009/2010 school year with children in Grade 4. In the fifteen years since, over three-quarters of BC school districts, and several independent and First Nations schools across BC, have administered the MDI. MDI surveys are now available for students in Grades 4 through 8. Since 2009, more than 300,000 BC students have participated in the MDI. Available annually, school districts can choose what grades and how frequently they want to participate in the survey.
The map below shows which school districts participated in MDI data collection in the 2023/24 school year. Hover over a school district to see which grades participated in the MDI. Zoom in to locate school districts of interest. To view Lower Mainland BC school districts, zoom in.
The graphic to the left shows the increase in the number of students that completed an MDI survey over time. Also shown is the breakdown of the number of students that participated from each grade (4-8) for the most recent school year.
Participating BC School Districts - 2011/12-2023/24 - Grade 4-8Click on a year in bar chart to view on the map. Use your mouse/trackpad or controls on top right of map to zoom in and out. Click and drag to pan the map. To view participating districts in the Lower Mainland you will need to zoom in.
The Well-Being Index
The Well-Being Index combines MDI measures relating to children's social and emotional development and physical health that are of critical importance during the middle years. These measures are: Optimism, Happiness, Self-Esteem, Absence of Sadness, and General Health. Scores from these five measures are combined and reported as three categories of well-being: low well-being, medium well-being, and high well-being (thriving). The graph below shows the percentage of children in Grades 4-8 that reported thriving in the 2023/24 school year, which was 29.6%.
Well-Being Index - 2023/24 - Grade 4-8Averages for each grade across participating school districts in the MDI data collection.
Grade 4
Grade 5
Grade 6
Grade 7
Grade 8
Shown together, a pattern of decreasing thriving is evident from Grade 4 to Grade 8. The percentage of students with thriving (green bar) decreases in a stepwise pattern with each higher grade (from 35% thriving for Grade 4 students down to 25.4% for students in Grade 8). This developmental trend has been noted across years of MDI data collection and is consistent with the research. 13-16 While the reason for this decline with age is not entirely clear, early adolescence is recognized as a turbulent time with many physiological and social changes. For many children, this period also includes school transitions (from elementary to middle school or elementary to high school). Health behaviours also change as children get older, such as increased sedentary behaviour and exposure to risk related to greater access and use of screens and social media.
Rates of Thriving Across the Province
The map below shows the percentage of children in Grades 4 to 8 that reported thriving for each participating school district in the 2023/24 school year. Toggle between the grades to see which districts participated in which grades. This is a heat map – the darker the colour (green), the higher the thriving rate. Also included below is a graph showing the range of thriving rates by grade for all participating school districts. For example, for children in Grade 5, thriving ranges from a low of 8% to a high of 50% across the 22 school districts that participated in MDI Grade 5 in the 2023/24 school year.
Map of BC School Districts - Grade 4 - Thriving 2023/24Use your mouse/trackpad or controls on top right of map to zoom in and out. Click and drag to pan the map. To view participating districts in the Lower Mainland you will need to zoom in.
To further explore MDI data in other geographies and across time, please visit our MDI Data Dashboard.
Declining Thriving Over Time
The current state of mental health and well-being among children and youth in Canada has been called a “mental health crisis”. 17 Recent estimates indicate that one in eight children under the age of 18 experience a mental health disorder and one in five children self-report their mental health as fair or poor. 18,19 With more than a decade of MDI surveys collected in school districts annually, MDI data are ideal for monitoring changes in social-emotional and mental well-being over time. In BC, MDI data collected over the last decade from participating school districts demonstrate a steady decline in the percentage of children reporting thriving (high well-being), particularly during the COVID pandemic (see graph below). This decline over time is consistent with other Canadian and international research. 13,20 However, as can be seen in the graph below, the most recent data show hopeful signs of trends moving in a positive direction.
Thriving Trend - 2015/16-2023/24 - Grade 4-8Click on a grade in the legend to add or remove the related trend line. Data collection for MDI Grades 5, 6 and 8 began in 2020/21.
Recent research based on 8 years of MDI data (2015-2022) found that declines in well-being over time were significantly more pronounced among girls than boys and were evident for children regardless of the socio-economic status (SES) of their neighbourhood (low, medium or high SES).21 Overall, girls reported lower levels of happiness and higher rates of sadness than boys. However, trends over time were more stable for children who reported the presence of protective factors related to connectedness - school connectedness, peer belonging, and supportive adults in school. Moreover, the happiness and sadness rates over time were similar between girls and boys who reported the presence of these connectedness factors. This research demonstrates that connectedness with adults and peers, and to school are key modifiable factors in mental health promotion efforts.
The Assets Index
The Assets Index is a measure of key resources and influences present in children's lives that help promote positive development and well-being. These assets include: Adult Relationships (adults in school, in the neighbourhood, and at home), Peer Relationships (peer belonging, friendship intimacy), Nutrition & Sleep (eating breakfast, meals with adults at home, frequency of good sleep), and Out-of-School Activities (organized activities).
MDI data has consistently demonstrated that the greater the number of assets in children’s lives, the more likely they are to report higher well-being, and each additional asset is associated with a further increase in well-being.22,23
Presence of Assets Across the Province
The map below shows the percentage of children by grade for each participating school district who indicated the presence of these assets in their lives in the 2023/24 school year. This is a choropleth map, the darker the colour (orange/brown), the higher the percentage of the asset selected. Explore the four assets by toggling the buttons at the top of the map – Adult Relationships, Peer Relationships, Nutrition & Sleep, and Out-of-School Activities – and between the grades on the map.
Use your mouse/trackpad or controls on top right of map to zoom in and out. Click and drag to pan the map. To view participating districts in the Lower Mainland you will need to zoom in.
To further explore MDI data in other geographies and across time, please visit our MDI Data Dashboard.
Healthy Habits
The MDI questionnaire was recently updated to align with the Canadian 24-Hour Movement Guidelines recommendations for physical activity, sleep, and screen time.12 MDI data from the 2023/24 school year about these healthy habits and their relationship to children's reported well-being is explored below.
Note: For most of the graphs below, toggle between data combined for children in Grades 4-5 and data combined for children in Grades 6-8. These data include all school districts that participated in data collection across the grades indicated. Grouping children into Grades 4-5 and Grades 6-8 is consistent with the two different versions of the MDI survey and reflects the typical developmental differences between pre-adolescent and early-adolescent children.
Physical Activity
The Canadian 24-hour Movement Guidelines recommends children 5-17 years of age accumulate at least 60 minutes per day of moderate to vigorous physical activity.12 View MDI Physical Activity Question
Daily Physical Activity
Just under one-third of children in Grades 4-5 (29.6%) and in Grades 6-8 (28.7%) reported meeting the recommended 60 minutes or more of physical activity every day.
Well-being & Activity
This bar graph shows the relationship between physical activity and reported well-being on the MDI Well-Being Index. Children in Grades 4-5 and Grades 6-8 who reported being physically active at least 60 minutes every day were more likely to report thriving (high well-being) compared to those who did not meet the recommendation.
Sleep
The Canadian 24-hour Movement Guidelines reccomends nine to eleven hours of uninterrupted sleep per night for children aged 5-13.12 The MDI asks about the frequency children get a good night's sleep in a week, and about typical bedtime and wake-up time during weekdays. View the MDI sleep questions
Hours of Sleep at Night
Using the reported wake-up and bedtimes, the average night's sleep was calculated for each grade. There was a stepwise decrease in children reporting that they met the recommendation of at least nine hours of sleep per night – with almost all children in Grade 4 (82.3%) reporting they met the recommendation down to just half of the children in Grade 8.
Well-being and Hours of Sleep
This bar graph demonstrates the relationship between sleep and well-being. Children who reported meeting the recommendation of at least 9 hours of sleep per night were more likely to report thriving across Grades 4-5 and Grades 6-8.
Screen Time & Social Media
The Canadian 24-hour Movement Guidelines recommend that children aged 5 to 17 years have no more than two hours of recreational screen time per day.12 The MDI asks children the number of hours per day in a typical week they spend on screens (including watching TV, playing video games, hanging out with friends on the phone, among other types of screen time). Questions about social media use are included in surveys for children in Grades 6 to 8. View the MDI screen and social media questions
The bar charts below show the percentage of children who reported using different types of screen time: never, fewer than two hours per day, or more than two hours per day. It is evident in these graphs that children use a variety of screen types every day and, based on the number of hours reported, are likely using more than one screen type at a time (for example, playing video games while communicating with friends on cell phones). Younger children were more likely to report playing video games and watching TV while older children were more likely to report spending time communicating with friends remotely and using social media. Notably, between 23.6% to 53.4% of children reported using various screen types for more than the recommended two or fewer hours per day. To see one category of time (for example “never”), toggle the amounts of time on and off on the graph legend.
Well-being & Screen Time
The line graph below demonstrates the relationship between different types of screen time and reported rates of thriving (high well-being) for children in Grades 6-8. Consistent with other research 24-27, MDI data show that rates of reported thriving decrease with increased hours of screen time per day.
The so-called Goldilocks Effect can also be seen above for all types of screen time: a little bit of screen time is best.28 Children who reported “never” having screen time had slightly lower thriving rates than those who reported using screens for an hour or less per day. While there is no definitive answer for this effect, it may be related to having access to technology at home and feeling included in screen time related activities - just a little bit seems better than none. However, too much screen time, such as binge-watching TV shows, playing video games, texting with friends, or using social media for large amounts of time each day is associated with lower well-being.
Well-being & Social Media Use
The pie chart below shows that almost 40% of children in Grades 6-8 reported using social media two or more hours per day (more than the recommended amount for all screen types in one day for this age group). The bar graph shows the relationship between social media use and well-being; children who reported using social media two or more hours per day were more likely to report low well-being.
Social Media Use, Hours per Day
Well-being by Social Media Use
Healthy Habits & Well-Being
The charts below combine data across all three healthy habit areas into one indicator, showing the percentage of children who reported meeting the recommendations for sleep (at least nine hours per night), low screen use (two hours or fewer per day), physical activity (60 minutes or more daily), and the relationship to reported well-being.
Number of Healthy Habits
The pie graph shows that just 9.3% of children in Grades 4-5 and 3.5% of children in Grades 6-8 met the recommendations across all three healthy habit categories. Also, one-third of children in Grades 6-8 reported that they did not meet the recommendations across any of these areas.
Healthy Habits and Well-Being
The bar graph shows the stepwise relationship between the number of healthy habits and well-being rates. The graph demonstrates that children who reported meeting the recommendations across one or more of the three areas were more likely to report thriving (high well-being).
Climate Concerns
A growing body of research suggests that children are experiencing increasing eco-anxiety as the effects of climate change become more evident and children have increasing access to constant negative information about the environment.29-33 In 2022/23, a new set of questions about climate and environmental issues was added to the MDI, including questions about climate change, species extinction, deforestation, and pollution. Below are the results from the 2023/24 data collection across topic areas and grades. Evident below is that most children across all grades reported being at least “a little” to “very much” concerned about all four topic areas – with pollution raising the most concern for all grades. View the MDI climate concern questions
Climate Change
Pollution
Deforestation
Extinction
Conclusion
Although the Middle Years Development Instrument (MDI) is a comprehensive and powerful tool that gathers data on child well-being and assets, the ultimate goal of the MDI project is not just about gathering data — it is about providing important information that can be used to amplify children's voices and catalyze action to support children to thrive and flourish both inside and outside of school. MDI data are used across sectors and community partners, by families and children themselves, to work collectively toward positive change during this important transitional time in children's lives.
Opportunities to improve children’s well-being and the assets in their lives exist at multiple levels from family and peer relationships to classroom environments and activities, school culture, community services, and government policy. To learn more about the research behind the MDI, including evidence-based examples of actions at home, school, and in the community through our key resources below.
Key Resources
MDI Data Dashboard
Access MDI data for your community through the MDI Data Dashboard - a new online and interactive tool for exploring MDI data from participating BC school districts and independent schools over the past five years. This platform provides a comprehensive view of children's well-being at both the district and neighbourhood levels and includes data from the 2018/19 to 2023/24 school years. Note: The MDI Dashboard was recently updated, covering more areas including data about social media use, sleep, climate concerns, active travel to and from school, and much more!
2023/24 MDI Data Trends Webinar
Watch the latest 2023/24 MDI Data Trends webinar featuring Dr. Eva Oberle, Principal Investigator of the MDI, a walk-through of the updated MDI Data Dashboard, and guest speaker Lianne Carley, VCH Senior Policy Lead, providing an overview of new resources for municipal and local governments: BC Healthy Communities Child & Youth Mental Well-being Resources.

Discover MDI
Discover MDI is an online guide for all things MDI — from understanding the MDI and the importance of middle childhood, to collecting, exploring, and sharing MDI data, to using MDI data to catalyze action designed to improve the well-being of children in the middle years.

MDI Quicksheets
A compilation of two-page, downloadable, PDF summaries of key MDI concepts, including research highlights and ideas for moving to action with MDI results.

Get Outside!
Recently released Toolkits from Outside Play UBC Lab: Discover tools aimed at helping parents, caregivers and educators gain the confidence and skills to support children's outdoor learning and play.
Suggested Citation
Oberle E. & the Human Early Learning Partnership (HELP). British Columbia Provincial Report - the Middle Years Development Instrument (MDI) 2024. Vancouver, BC: University of British Columbia, School of Population and Public Health, HELP; 2024 Sep. Available from: https://earlylearning.ubc.ca/mdi-2024-provincial-summary.
References
- Barican JL, Yung D, Schwartz C, Zheng Y, Georgiades K, Waddell C. Prevalence of childhood mental disorders in high-income countries: a systematic review and meta-analysis to inform policymaking. Evid Based Ment Health. 2022;25(1):36-44. Available from: https://mentalhealth.bmj.com/content/ebmental/25/1/36.full.pdf
- Gadermann A, Thomson K, Vent-Schmidt R, E. J. The impact of COVID-19 on the mental health of families and children. Richmond Hill, ON: Canadian Science Policy Centre; 2020. Available from: https://sciencepolicy.ca/news/impact-covid-19-mental-health-families-and-children
- Maunula L, Dabravolskaj J, Maximova K, Sim S, Willows N, Newton AS, et al. “It’s very stressful for children”: elementary school-aged children’s psychological wellbeing during COVID-19 in Canada. Children. 2021;8(12):1185. Available from: https://www.mdpi.com/2227-9067/8/12/1185
- Samji H, Kaufmann JG, del Casal J-M, Long D, Best J, Maloney J, et al. Improving youth mental health and well-being during the COVID-19 recovery phase in BC. Vancouver, BC: BC Children’s Hospital Research Institute; 2023. Available from: https://chartlab.ca/wp-content/uploads/2023/05/Improving-Youth-Well-being-in-the-COVID-19-Recovery-Phase-in-BC.pdf
- UNICEF Office of Research - Innocenti. Life in Lockdown: child and adolescent mental health and well-being in the time of COVID-19. Florence, Italy: Innocenti Research Report; 2021 Dec. Available from: https://www.unicef.org/innocenti/reports/life-in-lockdown
- Waddell, C, Schwartz C, Barican J, Yung D, Gray-Grant D. COVID-19 and the impact on children’s mental health. Burnaby, BC: Children’s Health Policy Centre, Simon Fraser University; 2020 Sep. Available from: https://rcybc.ca/wp-content/uploads/2020/11/Impact-of-COVID.pdf
- Butler N, Quigg Z, Bates R, Jones L, Ashworth E, Gowland S, et al. The contributing role of family, school, and peer supportive relationships in protecting the mental wellbeing of children and adolescents. Sch Ment Health. 2022;14(3):776-88. Available from: https://doi.org/10.1007/s12310-022-09502-9
- Foster CE, Horwitz A, Thomas A, Opperman K, Gipson P, Burnside A, et al. Connectedness to family, school, peers, and community in socially vulnerable adolescents. Child Youth Serv Rev. 2017;81:321-31. Available from: https://www.sciencedirect.com/science/article/pii/S0190740917301172
- Sampasa-Kanyinga H, Chaput J-P, Goldfield GS, Janssen I, Wang J, Hamilton HA, et al. The Canadian 24-hour movement guidelines and psychological distress among adolescents. Can J Psychiatry. 2021;66(7):624-33. Available from: https://journals.sagepub.com/doi/abs/10.1177/0706743720970863
- Tomasone J, Janssen I, Saunders T, Duggan M, Jones R, Brouwers M, et al. Timing of 24-hour movement behaviours: implications for practice, policy and research. Health Promot Chronic Dis Prev Can. 2022;42(4):170-4. Available from: https://doi.org/10.24095/hpcdp.42.4.05
- Tremblay MS, Chaput J-P, Adamo KB, Aubert S, Barnes JD, Choquette L, et al. Canadian 24-hour movement guidelines for the early years (0–4 years): an integration of physical activity, sedentary behaviour, and sleep. BMC Public Health. 2017;17(5):874. Available from: https://doi.org/10.1186/s12889-017-4859-6
- Canadian Society for Exercise Physiology. Canadian 24-hour movement guidelines for the children and youth (5-17 years): an integration of physical activity, sedentary behaviour, and sleep. Ottawa, ON: Canadian Society for Exercise Physiology; 2024. Available from: https://csepguidelines.ca/
- Helliwell JF, Layard R, Sachs JD, Neve J-ED, Aknin LB, Wang S. World happiness report 2024. Oxfod, England: Wellbeing Research Centre, University of Oxford; 2024 Mar 20. Available from: https://worldhappiness.report/ed/2024/
- Ontario Agency for Health Protection and Promotion (Public Health Ontario). Mental health indicators using data from the Canadian Health Survey of Children and Youth 2019. Toronto, ON: King's Printer for Ontario; 2024 Jun. Available from: https://www.publichealthontario.ca/-/media/Documents/C/24/chscy-mental-health-indicators-data.pdf?rev=6db01be5d4d349e7900baae897f80d0c&sc_lang=en
- Samji H, Maloney J, Whitehead J, Low B, Lee J, Herring J, et al. Youth Development Instrument (YDI) Provincial report 2022-2023. Burnaby, BC: Simon Fraser University Faculty of Health Sciences, Capturing Health and Resilience Trajectories (CHART) lab; 2023 Nov. Available from: https://chartlab.ca/wp-content/uploads/2023/11/YDI-2022-2023-Provincial-Report_2023-11-21.pdf
- Thomson KC, Richardson CG, Samji H, Dove N, Olsson CA, Schonert-Reichl KA, et al. Early childhood social-emotional profiles associated with middle childhood internalizing and wellbeing. J Appl Dev Psychol. 2021;76:101301. Available from: https://www.sciencedirect.com/science/article/pii/S0193397321000642.
- Moradkhan M, Vatanpour S. Youth mental health crisis: the pandemic fallout. Toronto, ON: UNICEF Canada; 2023 Aug 31. Available from: https://www.unicef.ca/en/blog/youth-mental-health-crisis-pandemic-fallout.
- Schwartz C, Barican J, Yung D, Gray-Grant D, Waddell C. Children’s mental health: the numbers and the needs. Child Mental Health Res Quart. 2022;16(2):1-15. Available from: https://childhealthpolicy.ca/wp-content/uploads/2022/05/RQ-16-22-Spring.pdf.
- Statistics Canada. 2023 Canadian Health Survey on Children and Youth — Changes in the mental health of respondents from the 2019 survey. Ottawa, ON: Statistics Canada; 2024 Seo 10. Available from: https://www150.statcan.gc.ca/n1/daily-quotidien/240910/dq240910a-eng.htm.
- Smith A, Poon C, Peled M, Forsyth K, Saewyc E, McCreary Centre Society. The big picture: an overview of the 2023 BC Adolescent Health Survey provincial results. Vancouver, BC: McCreary Centre Society; 2024 Feb. Available from: https://mcs.bc.ca/pdf/2023_bcahs_the_big_picture.pdf.
- Oberle E, Ji XR, Molyneux T, Alkawaja M, Guhn M, Forer B, et al. Mental well-being trends and protective factors among adolescents in British Columbia from 2015 to 2022: a population-based repeated cross-sectional study. Paper presentation at Public Health 2024, Halifax, NS. 2024.
- Guhn M, Schonert-Reichl KA, Gadermann AM, Marriott D, Pedrini L, Hymel S, et al. Well-being in middle childhood: an assets-based population-level research-to-action project. Child Ind Res. 2012;5(2):393-418. Available from: https://doi.org/10.1007/s12187-012-9136-8.
- Oberle E, Guhn M, Gadermann AM, Thomson K, Schonert-Reichl KA. Positive mental health and supportive school environments: A population-level longitudinal study of dispositional optimism and school relationships in early adolescence. Soc Sci Med. 2018;214:154-61. Available from: https://www.sciencedirect.com/science/article/pii/S0277953618303551.
- Kwon S, Armstrong B, Wetoska N, Capan S. Screen time, sociodemographic factors, and psychological well-being among young children. JAMA Netw Open. 2024;7(3):e2354488. Available from: https://jamanetwork.com/journals/jamanetworkopen/fullarticle/2815689.
- Li X, Vanderloo LM, Keown-Stoneman CDG, Cost KT, Charach A, Maguire JL, et al. Screen use and mental health symptoms in Canadian children and youth during the COVID-19 pandemic. JAMA Network Open. 2021;4(12):e2140875-e. Available from: https://doi.org/10.1001/jamanetworkopen.2021.40875.
- Muppalla SK, Vuppalapati S, Reddy Pulliahgaru A, Sreenivasulu H. Effects of excessive screen time on child development: an updated review and strategies for management. Cureus. 2023;15(6):e40608. Available from: https://doi.org/10.7759%2Fcureus.40608.
- Oberle E, Ji XR, Kerai S, Guhn M, Schonert-Reichl KA, Gadermann AM. Screen time and extracurricular activities as risk and protective factors for mental health in adolescence: a population-level study. Prev Med. 2020;141:106291. Available from: https://www.sciencedirect.com/science/article/pii/S0091743520303157.
- Davie M. Screen time: how much is too much? Paediatr Child Health. 2022;32(8):307-10. Available from: https://www.sciencedirect.com/science/article/pii/S1751722222000877.
- Aylward B, Cunsolo A, Clayton S, Minor K, Cooper M, Chatwood S, et al. Examining the mental health impacts of climate change on young people in Canada: a national cross-sectional survey. Lancet Planetary Health. 2024;8:S3. Available from: https://doi.org/10.1016/S2542-5196(24)00068-8.
- Brown M, Mirza S, Lu J, Stewart SL. Walking forward together—the next step: Indigenous youth mental health and the climate crisis. Psych. 2024;6(1):210-20. Available from: https://www.mdpi.com/2624-8611/6/1/13.
- Clayton S, Manning CM, Hill AN, Speiser M. Mental health and our changing climate: children and youth report 2023. Washington, DC: American Psychological Association and ecoAmerica; 2023 Oct. Available from: https://www.apa.org/news/press/releases/2023/10/mental-health-youth-report-2023.pdf.
- Martin G, Reilly K, Everitt H, Gilliland JA. Review: The impact of climate change awareness on children's mental well-being and negative emotions - a scoping review. Child Adol Mental Health. 2022;27(1):59-72. Available from: https://doi.org/10.1111/camh.12538.
- United States Environmental Protection Agency. Climate change and children’s health and well-being in the United States. Washington, DC: US EPA, Office of Atmospheric Protection; 2023 Apr. Available from: https://www.epa.gov/system/files/documents/2023-04/CLiME_Final%20Report.pdf.