The Human Early Learning Partnership (HELP) officially launches the EDI Data Dashboard
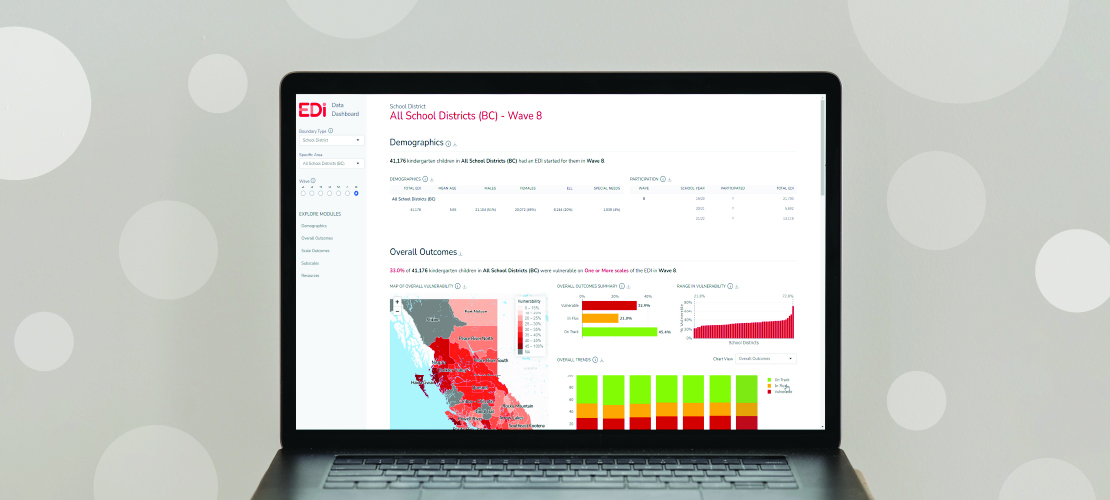
Explore NowHELP is thrilled to announce the launch of the Early Development Instrument (EDI) Data Dashboard — an online, interactive tool available to the public that allows for the exploration of patterns and trends in EDI data from Wave 2 (data collected 2004-2007) through Wave 8 (2019-2022).
The EDI is a questionnaire completed by kindergarten teachers for the students in their classrooms each year, gathering information across five key areas, or “scales”, of development: Physical Health & Well-being, Social Competence, Emotional Maturity, Language & Cognitive Development, and Communication Skills & General Knowledge.
In the latest EDI data release (Wave 8), reporting includes, for the first time, the full distribution of children’s developmental outcomes, identifying the percentage of children who are on track, vulnerable, or in between (“in flux”) in their development across the five EDI scales. Previously, only vulnerability rates were reported. Wave 8 revealed that almost half of children in BC (45.4%) are on track on all five scales of the EDI, 32.9% are vulnerable on one or more scales, and another 21.8% are in flux.
Through the EDI Data Dashboard, viewers can explore EDI data charts and maps at a number of levels—overall, scale, and subscale—and across several “boundary types”, including BC ministries of Education & Child Care, Health, Children & Family Development, as well as HELP-designated neighbourhoods. The data reported through the Dashboard are based on children’s home postal codes and include kindergarten children who live within the boundary type selected by the viewer.
To provide additional context to the Dashboard, HELP recommends that users begin with the EDI Wave 8 Provincial Summary. This provincial summary report provides an overview of EDI data trends and patterns for BC overall, including findings at the school district, community, and neighbourhood levels.
Users will also find several resources available to assist in navigating the EDI Data Dashboard, including a tour, a technical guide, as well as a slide deck template for building individual presentations.
Explore NowThe EDI Data Dashboard is HELP’s first foray into reporting data in this online and interactive format, and we want to hear from you! Please submit your feedback via this form.
We look forward to working with our partners across the province in support of BC’s children and families in 2023. Please share the link to the EDI Data Dashboard widely, and contact us at communications@help.ubc.ca should you have any questions.